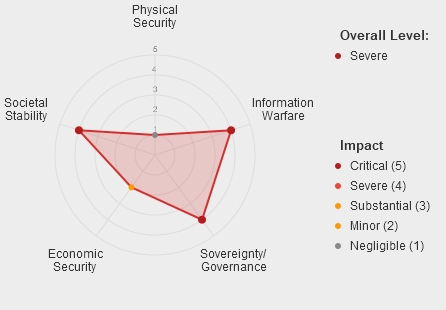
Harm categories based on the CSET Harm Taxonomy: https://cset.georgetown.edu/wp-content/uploads/20230022-Adding-structure-to-AI-Harm-FINAL.pdf
Scores reflect impacts ranging from 1 (‘Negligible’) to 5 ('Catastrophic’)

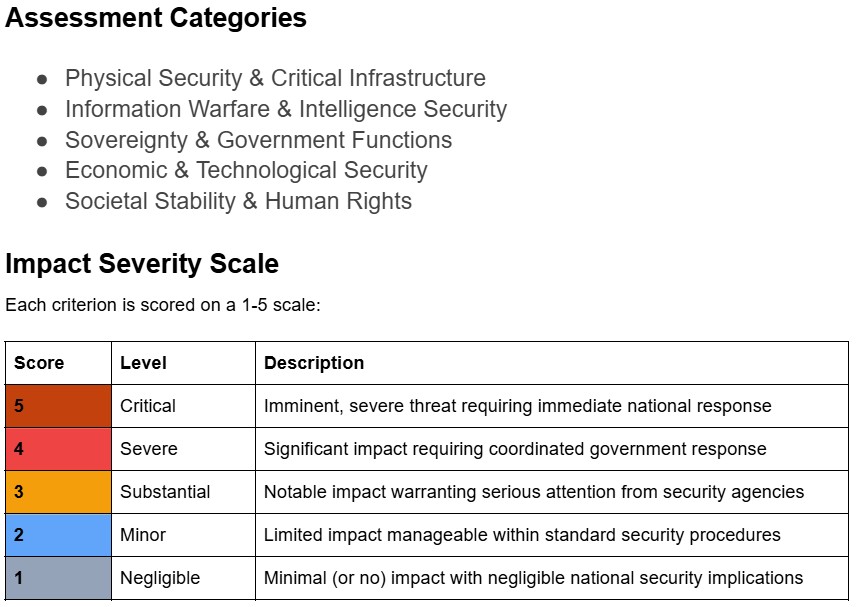
Harm categories based on the CSET Harm Taxonomy: https://cset.georgetown.edu/wp-content/uploads/20230022-Adding-structure-to-AI-Harm-FINAL.pdf
Scores reflect impacts ranging from 1 (‘Negligible’) to 5 ('Catastrophic’)