AI Ecosystem Actors
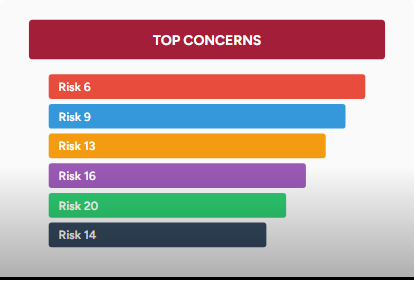
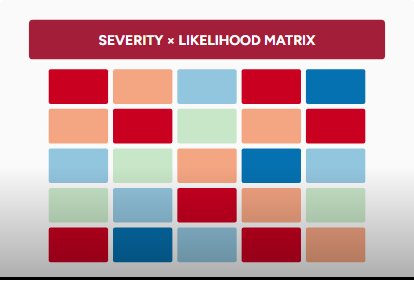
Understanding the framework used in this survey helps interpret the expert prioritization results. The following relevant sections explain the criteria experts used to assess risks, the AI ecosystem actors evaluated, and the industry sectors analyzed.
%20(250%20x%20100%20px).png)