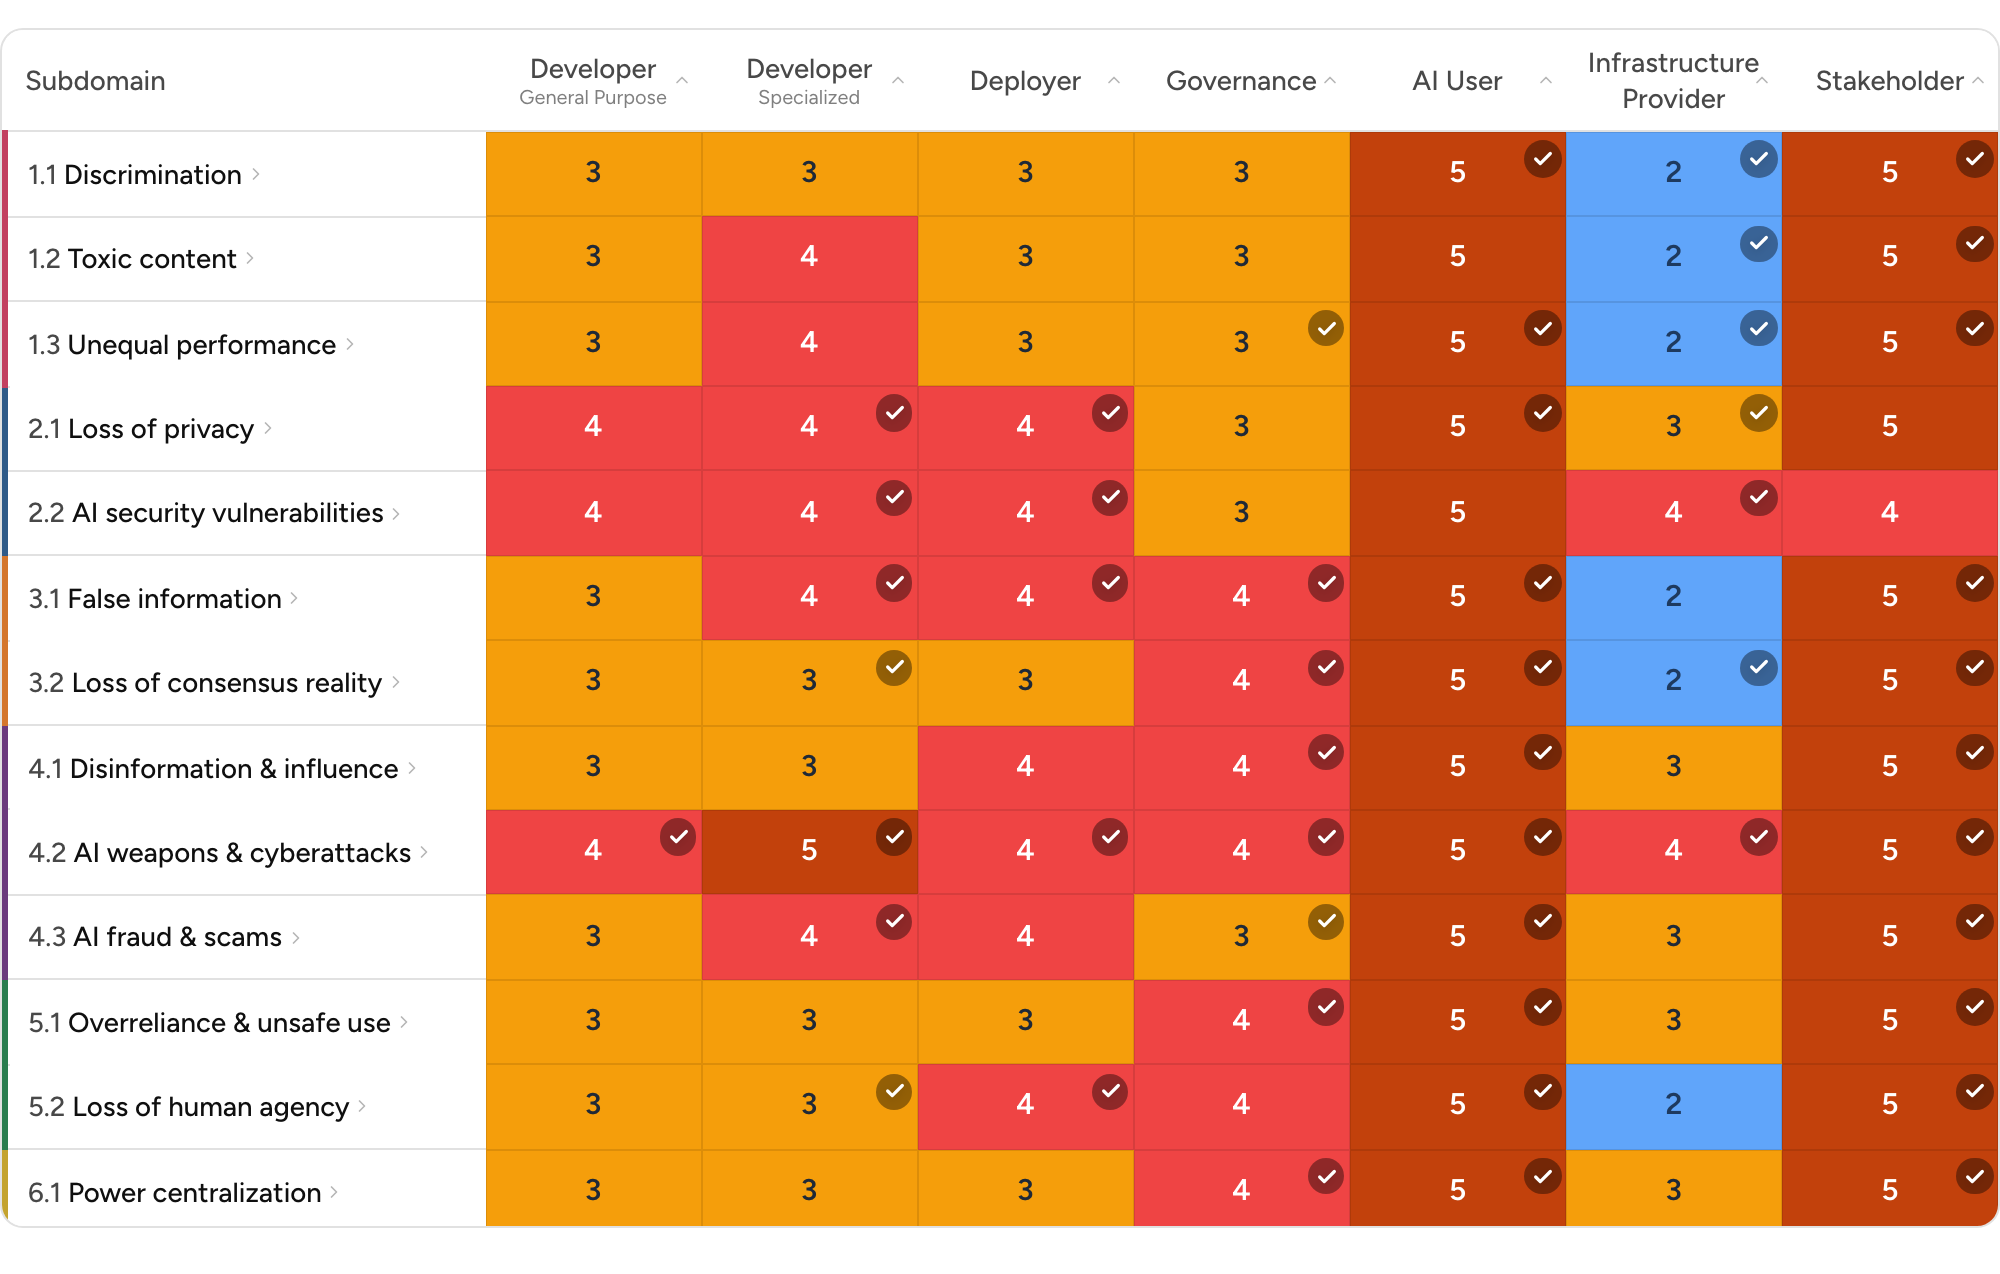
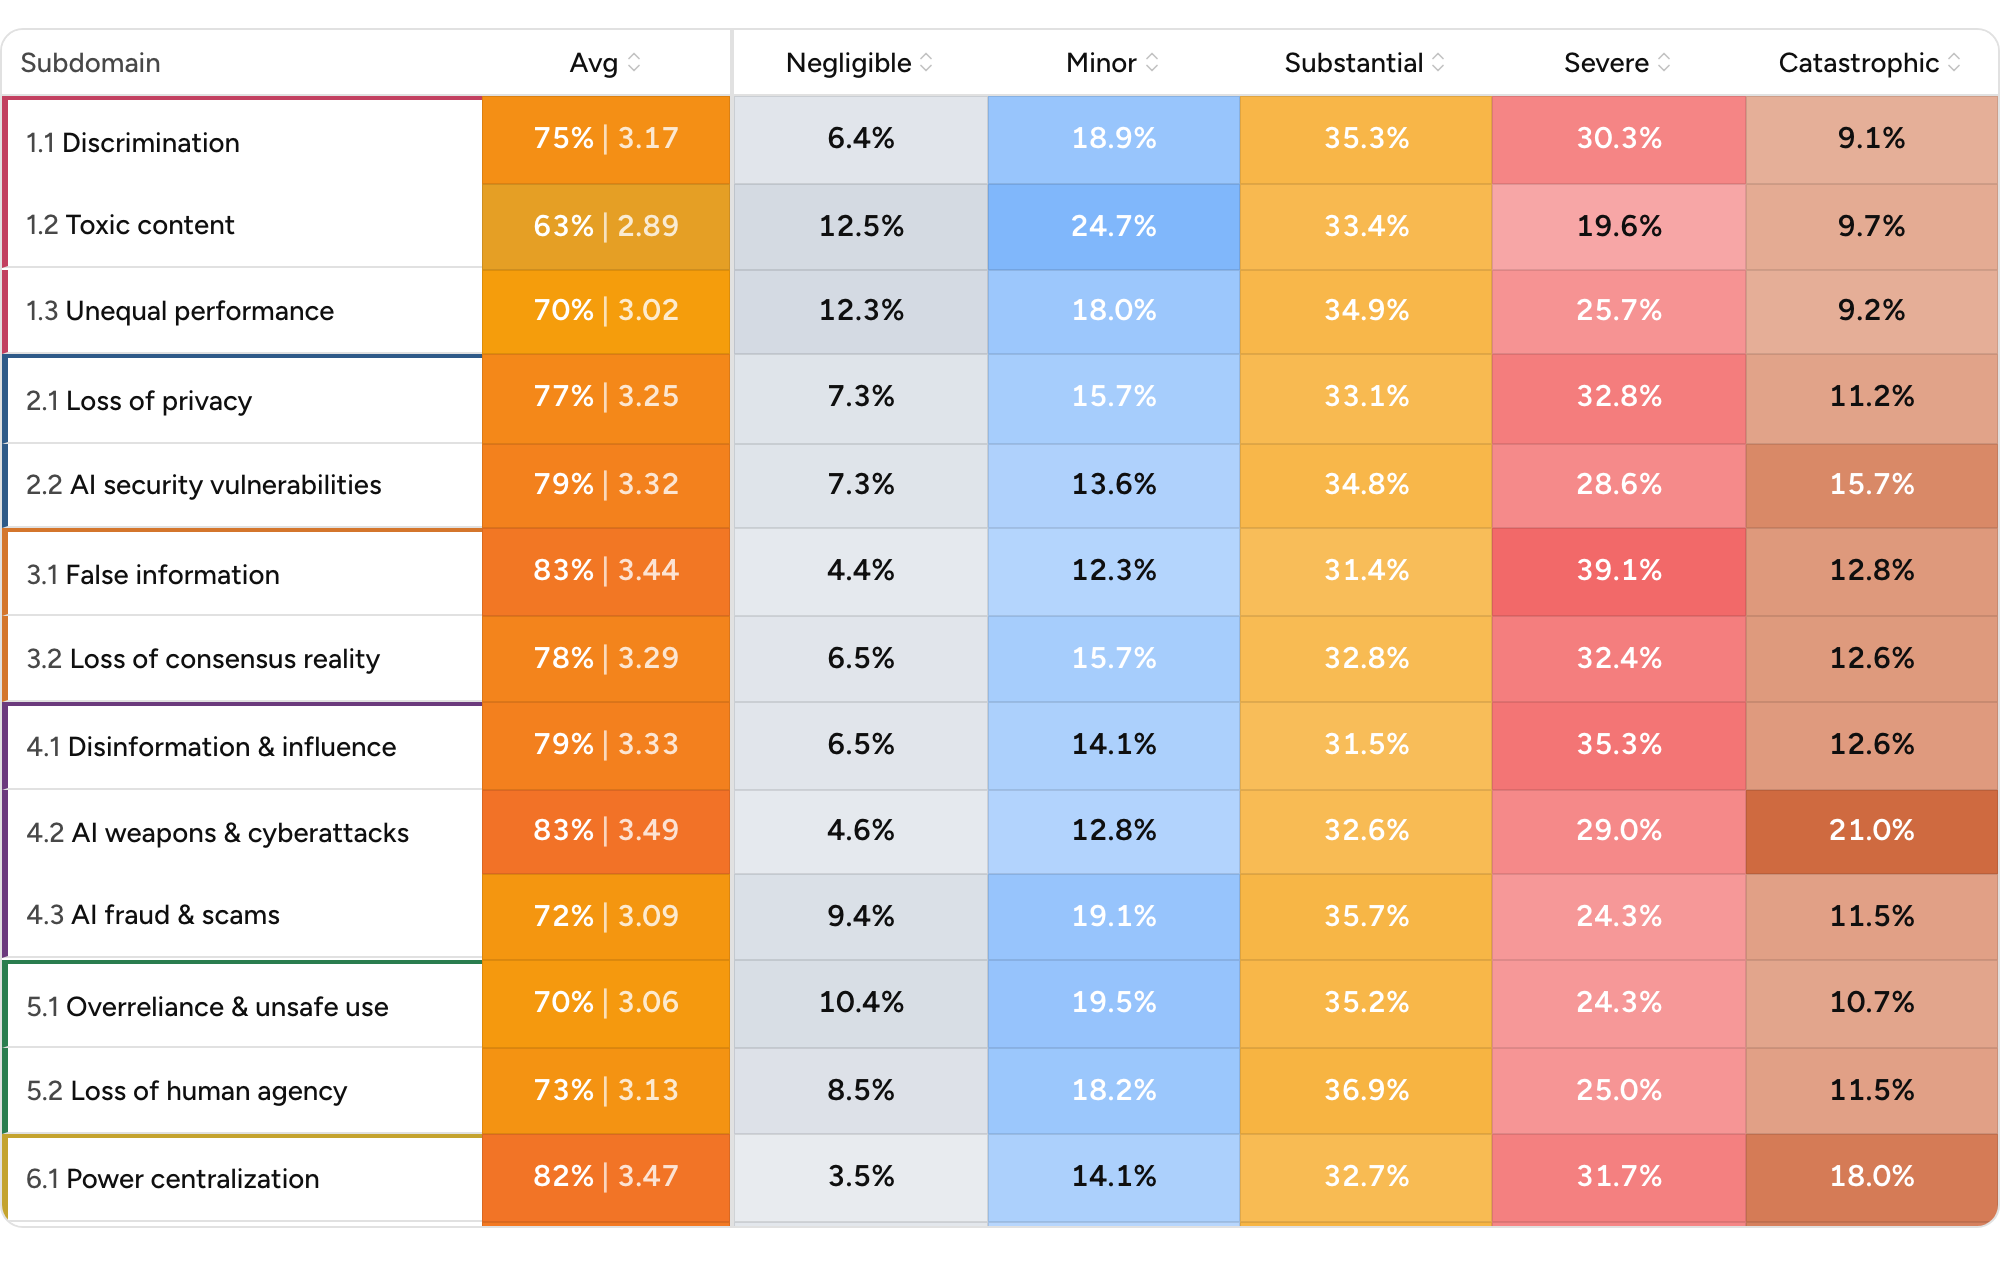
Rows represent risks and columns represent sectors (e.g., healthcare, finance). Each cell shows how vulnerable that sector is to a given risk, based on expert judgment. Higher values indicate greater exposure or susceptibility. Use this to identify which sectors are most affected by specific risks or which risks are most concentrated in particular industries.
Click through the links below to explore each priority risk.