This work is licensed under CC BY 4.0.
Spencer Michaels, Alexander Saeri, and Peter Slattery (2026). Introducing the AI Risk Navigator: An Exploration Tool for the AI Risk Initiative.
MIT's AI Risk Initiative (AIRI) maintains some of the most comprehensive datasets on AI risk available anywhere — thousands of catalogued risks from the academic literature, documented real-world AI incidents, governance documents from around the world, and concrete mitigation actions drawn from leading frameworks. The challenge is that these datasets have always existed in isolation from one another, and are inaccessible to a casual audience. Exploring any one of them meant losing sight of the rest.
Over the past several months, I have been working to fix that tension by building the AI Risk Navigator as part of my fellowship with the Cambridge Boston Alignment Initiative. It is a purpose-built interface that centralizes all of AIRI’s current datasets to let researchers, policymakers, and practitioners navigate the AI risk landscape as one interconnected body of knowledge.
This post introduces version 1 of the Navigator, walks through its core features, and outlines what is planned for future releases. I would welcome feedback and suggestions via this form.
My goal in creating the Navigator was twofold.
The first was accessibility. As a previous user of AIRI's data myself, I had encountered the friction that newcomers face when trying to access and navigate the datasets. AIRI's work is genuinely valuable — but raw Airtable interfaces, separate URLs for each dataset, and no shared navigation layer meant that making use of them required patience and prior familiarity. I wanted to lower that barrier and make the data accessible to a broader audience.
The second was interoperability. AIRI's datasets were developed independently, and while each is rigorous and well-maintained, there was no systematic way to move between them. Shared taxonomies, particularly the Risk Domain Taxonomy, offered an underexploited opportunity. If multiple datasets could be mapped onto the same classification structure, users could move fluidly between them — from a risk identified in the academic literature, to incidents where it has materialized, to the governance frameworks addressing it. This kind of interoperability would also encourage cross-dataset analysis.
Achieving both goals required navigating several constraints. The independent nature of the datasets means each carries methodological limitations that restrict how directly they can be compared — incidents are each classified under a single risk domain despite often spanning several; governance data skews toward U.S. sources and may not accurately represent global AI governance in aggregate. Rather than papering over these limitations, the Navigator is designed around them — selective about what cross-dataset comparisons it surfaces, and transparent about what the data can and cannot support.
AIRI’s datasets are individually valuable, but their real power lies in what they reveal when connected. The Navigator uses AIRI’s risk domain taxonomy as a shared backbone — pick a subdomain, and you can immediately see the academic risk landscape, the real-world incident record, and the governance response in one place. This is a valuable tool for a variety of users:
The Navigator is now publicly available at airi-navigator.com. Below, we walk through some of its key features.
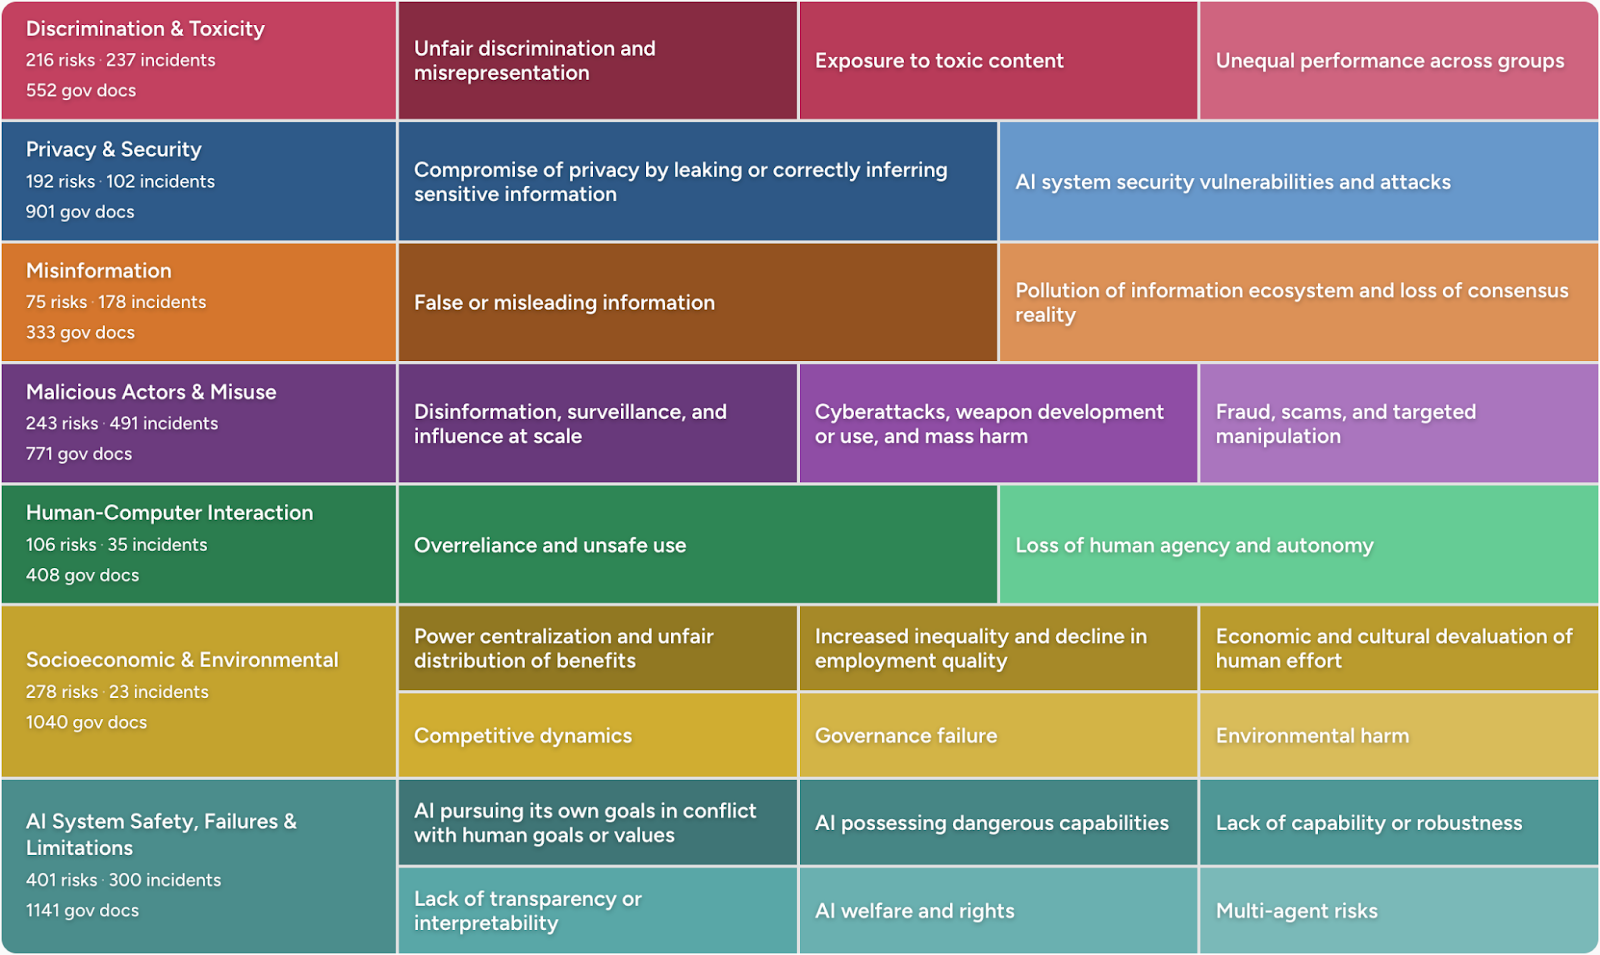
The central design decision in the Navigator was making AIRI’s risk domain taxonomy the primary entry point, rather than any individual dataset. The taxonomy — 7 domains spanning discrimination, privacy, misinformation, malicious use, human-computer interaction, socioeconomic harms, and AI system safety, broken into 24 more specific subdomains — gives every dataset a shared classification structure. A user can identify any corner of the AI risk landscape and immediately see what the academic literature says, what has actually happened, and what governance exists.
The taxonomy grid on the homepage serves as the primary entry point — click any domain or subdomain to start exploring.
The dedicated taxonomy page provides a full interactive reference for the classification structure, including definitions for every domain and the causal dimensions — entity, intent, and timing — that cut across the risk and incident datasets.
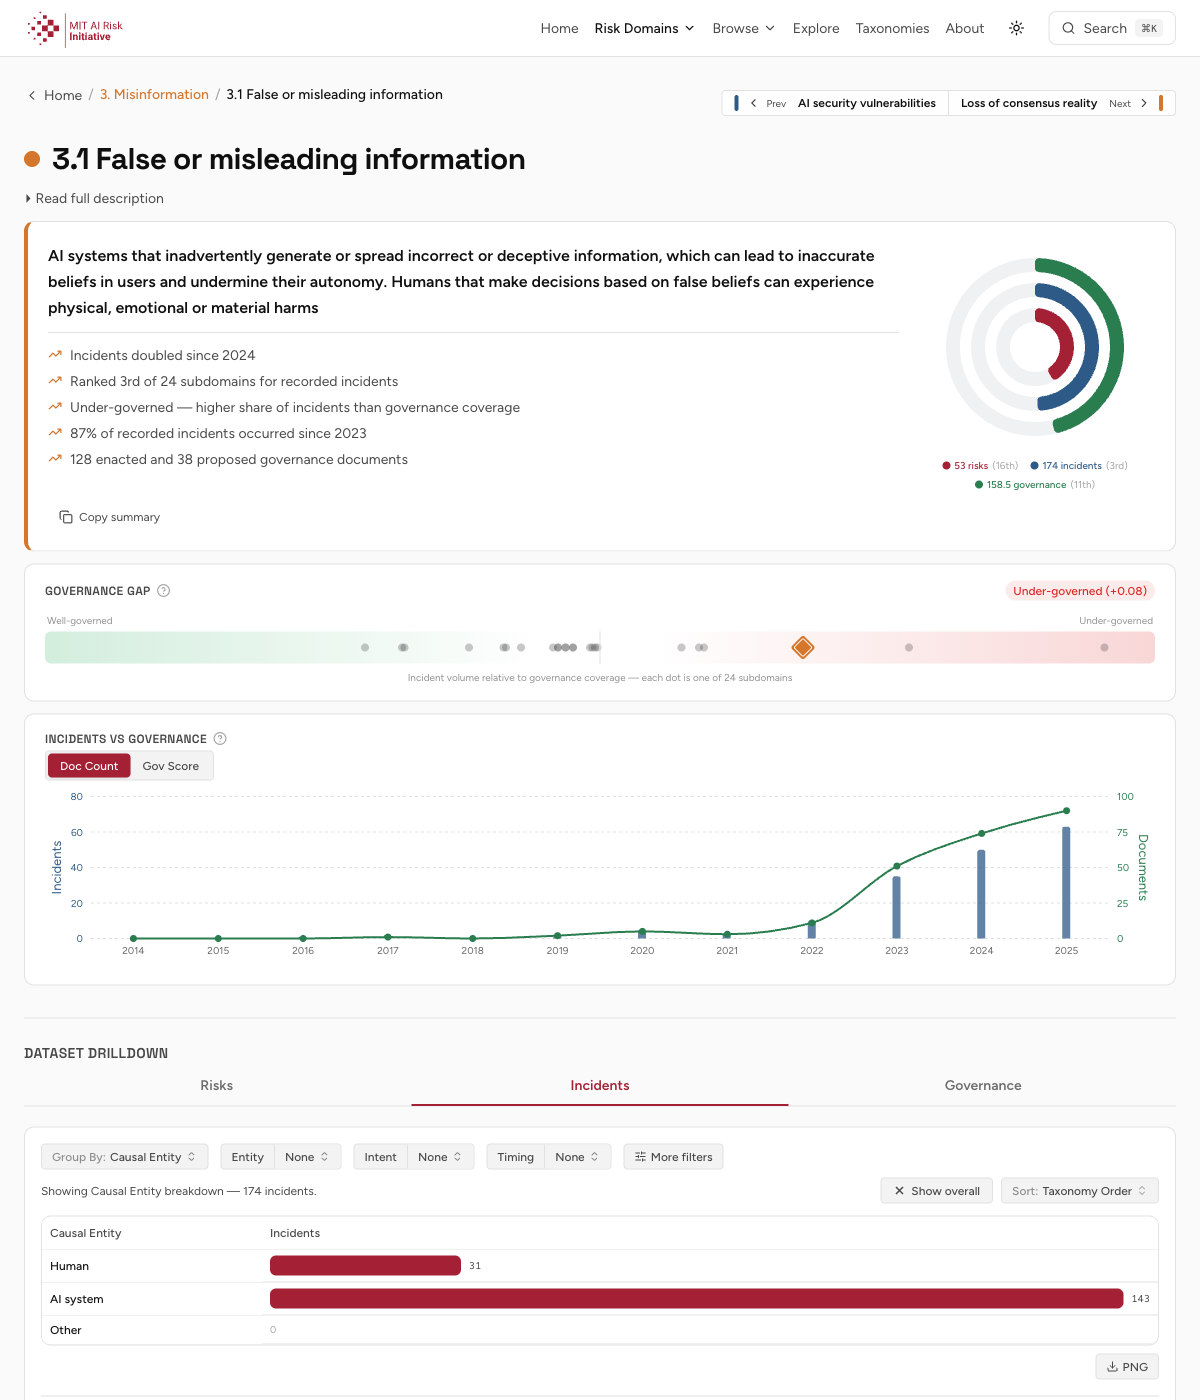
Each of the risk domains and subdomains have their own detail pages that bring together data from across AIRI's datasets in a single view. Rather than navigating four separate databases and mentally connecting what you find, you can arrive at a subdomain page and the relevant data is already assembled. Each page contains information about the subdomain, findings from the datasets, and visuals to understand how it’s represented in the data.
Each subdomain page opens with a definition and a few top findings, then pulls together the relevant slice of each dataset. Users can copy a brief summary containing the definition and top-level findings. The page offers co-location rather than synthesis: the datasets side-by-side, with the connections between them left for the reader to draw.
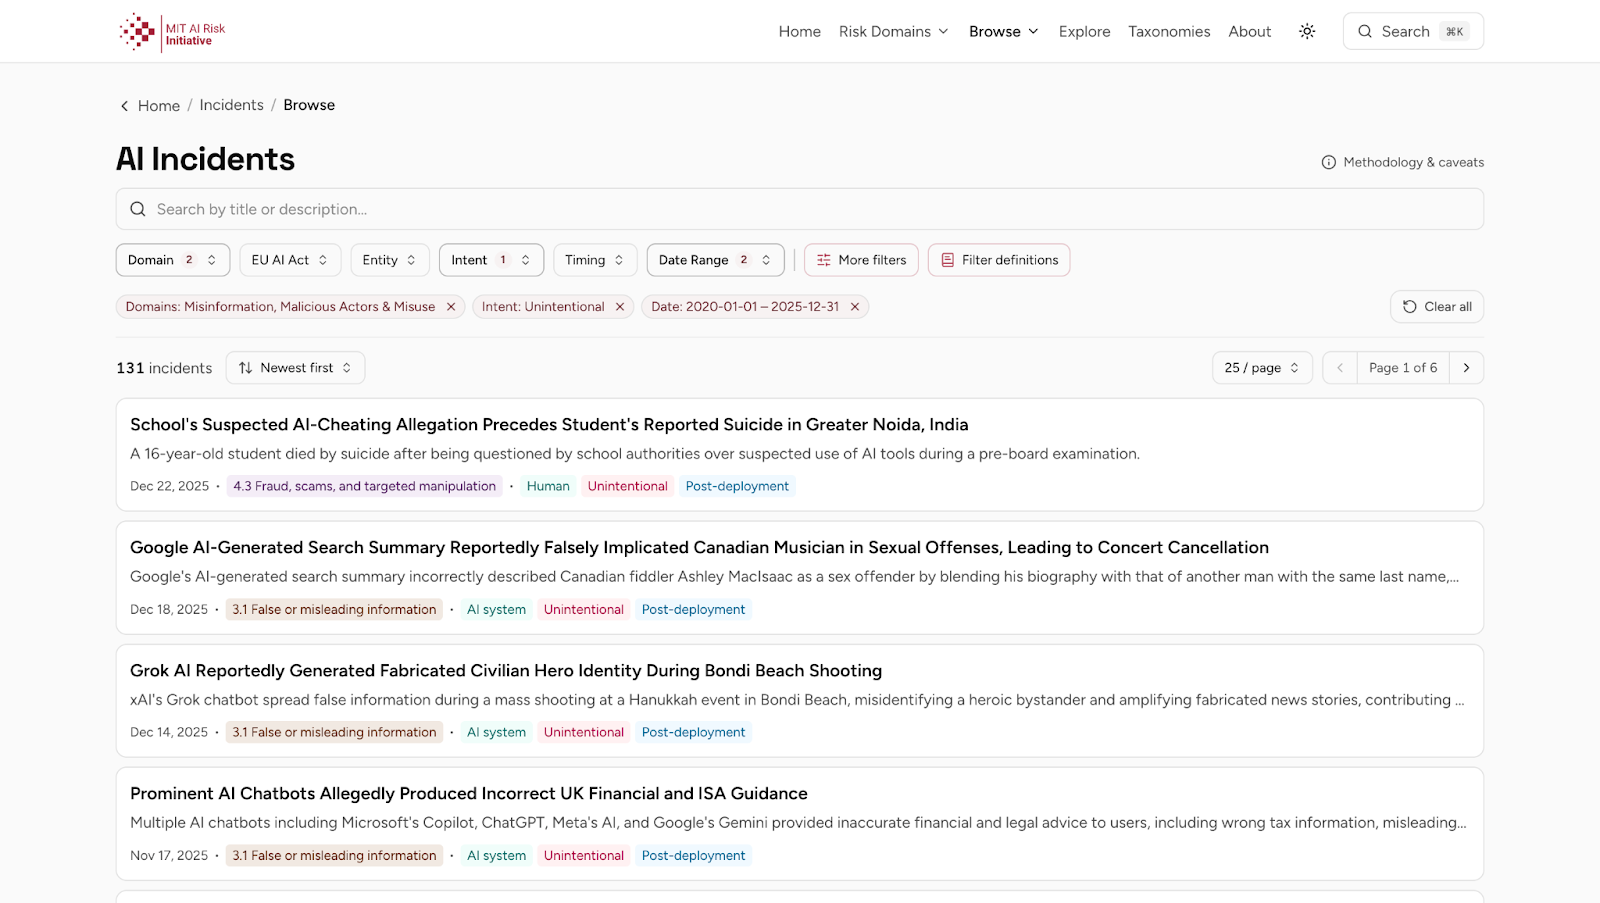
Each dataset has its own browse page with filterable, card-based views. For example, you can find all fraud-related incidents since 2012, or defunct state-level regulations that addressed bias. Selecting an item will open a modal with more details, from which you can open a page that contains all of the data AIRI has on a given incident, risk, or governance document.
The Navigator also includes a global search with semantic and keyword matching, enabling queries across all datasets, taxonomies, and definitions simultaneously. Searching “autonomous vehicles” or “facial recognition” returns all relevant information together in a single view.
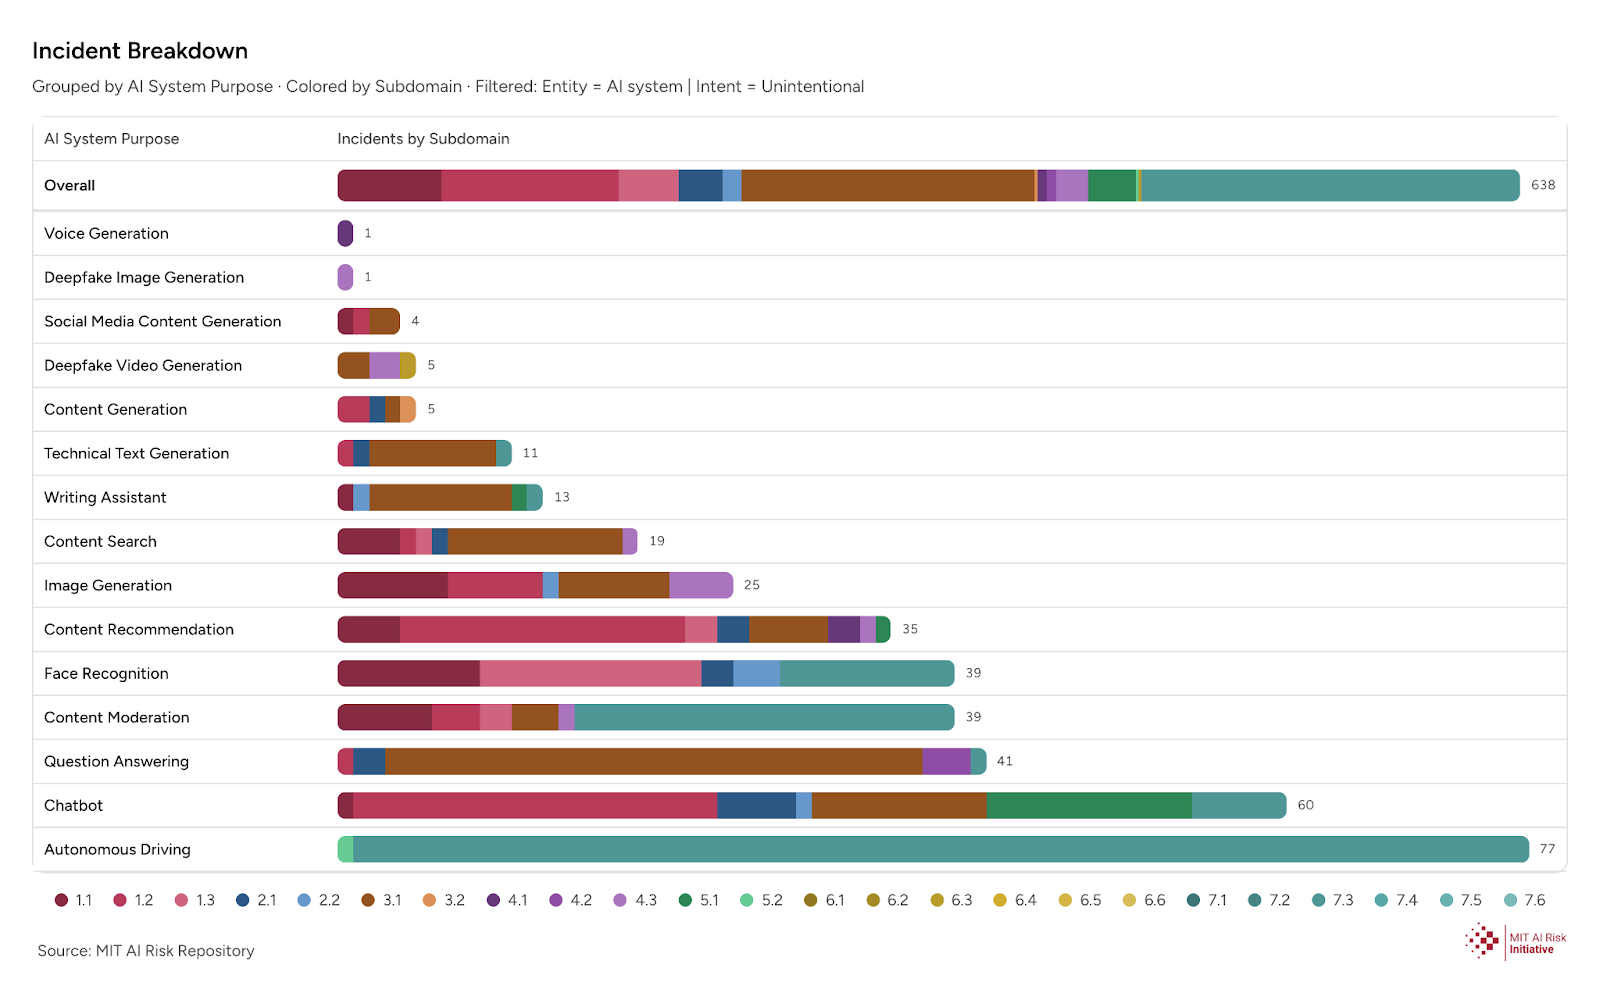
Each dataset has its own collection of visualizations providing a higher-level view of structure and distribution — how risks are spread across the taxonomy, where incidents cluster, which domains have the most or least governance coverage.
These complement the record-level browsing and search, giving users a way to orient themselves before diving into individual records. All charts are available for download for use in external reports and presentations. These visualizations are also planned for integration into the main AIRI website.
The Navigator is designed to grow with AIRI’s data, and several priorities are already defined for future releases.
The most immediate is dataset expansion. AIRI currently has three new datasets in varying stages of completion, and as the catalog grows from four to seven over the coming months, the Navigator will integrate them as they are published. Each addition will enable cross-dataset analyses that are not yet possible with the current coverage.
On the quality-of-life side, dark mode, additional visualizations, and downloadable data with codebooks are in active development. Further ahead, I am exploring a systematic mapping between AIRI's risk and mitigation taxonomies — closing the loop from identifying a risk to understanding what concrete actions can reduce it. The Navigator may also act as a foundation for a new AIRI website and branding. Development will continue to be shaped by user feedback, which can be submitted via the form here.
User feedback is crucial as we continue to refine and expand the Navigator. As this is an initial release, we are eager to receive feedback and suggestions from a wide range of users and use cases. While we welcome all comments, we are particularly eager to hear feedback on the following:
Please leave any feedback here before May 1, 2026.
The AI Risk Navigator was created during the spring 2026 fellowship at the Cambridge Boston Alignment Initiative with the financial support of Coefficient Giving. I would like to thank my mentors, Peter Slattery and Alexander Saeri, for their support and guidance; and Emre Yavuz, my research manager. A huge thank you to the entire CBAI cohort for making my time working on this project so enjoyable.
.png)

.png)