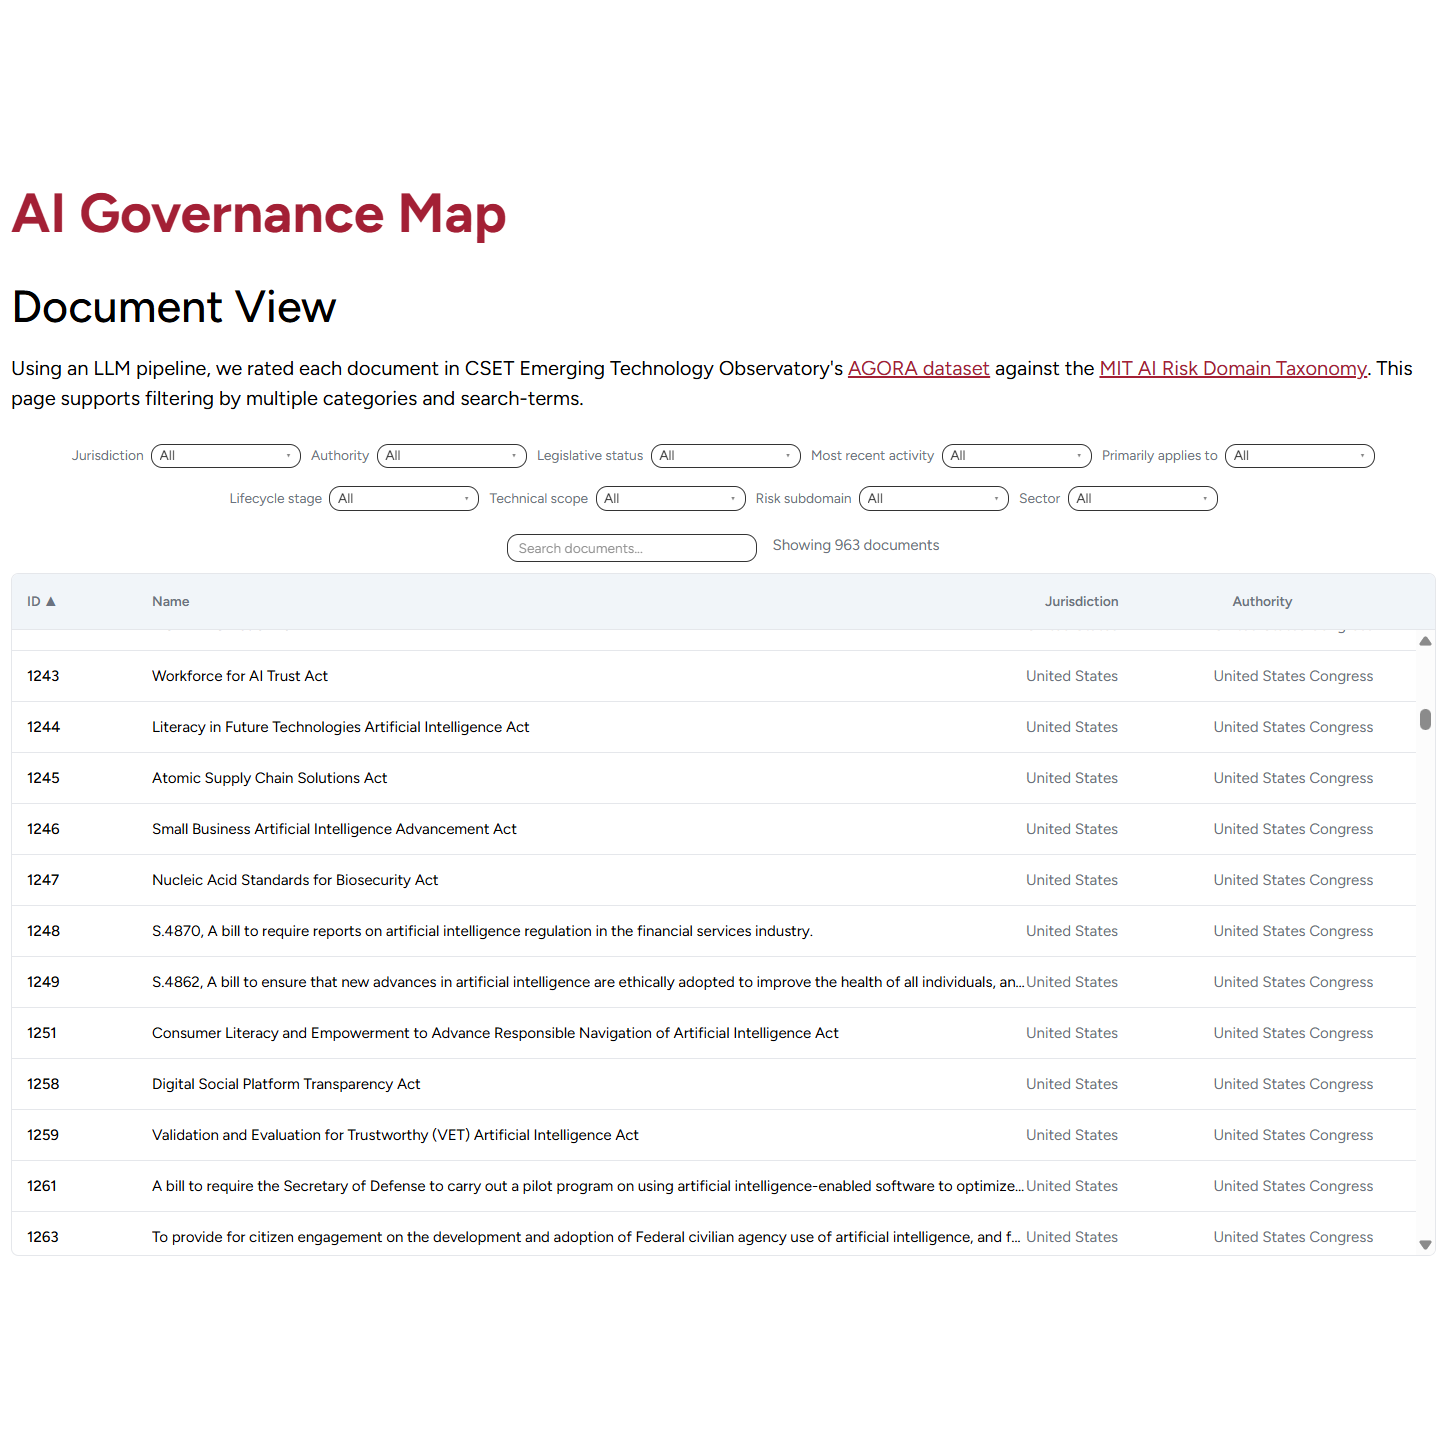
Using an LLM pipeline, we rated each document in CSET Emerging Technology Observatory's AGORA dataset against the MIT AI Risk Domain Taxonomy. See the pilot blog post for discussion of the methodology.
Insights from Risk Subdomain Analysis
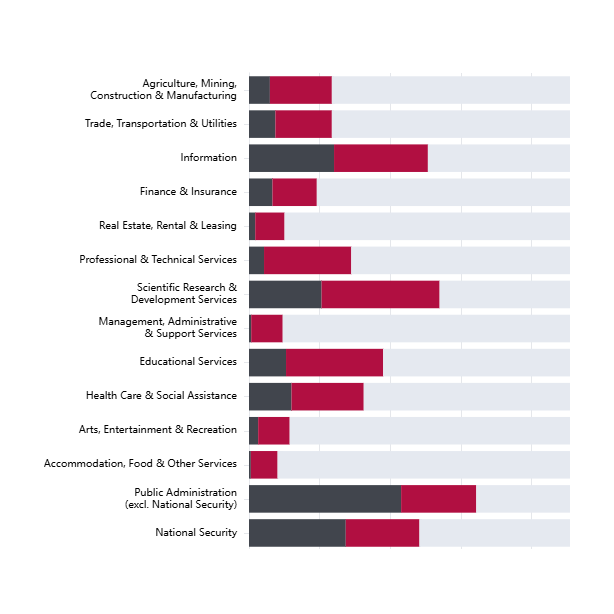
- The risk subdomains that are covered by the highest number of documents in the AGORA dataset are: AI System Security Vulnerabilities and Attacks, Governance Failure, Lack of Capability or Robustness, Compromise of Privacy, Lack of Transparency
- The risk subdomains covered by the fewest documents in the AGORA dataset are: AI Welfare and Rights, Multi-agent risks, Economic and Cultural Devaluation, Power Centralization, Environmental Harm
- Minority vs majority focus of subdomains within AGORA dataset: The most-covered subdomains tend to focus on model safety and established regulatory concerns (security, privacy, transparency), whilst less-well covered subdomains include socioeconomic risks (economic devaluation, power centralization) and emerging considerations (multi-agent risks, AI welfare).
- These coverage patterns may reflect the relative maturity of topics in policy discourse, the availability of technical or legal frameworks to address them, or how directly risks map to established regulatory concepts.
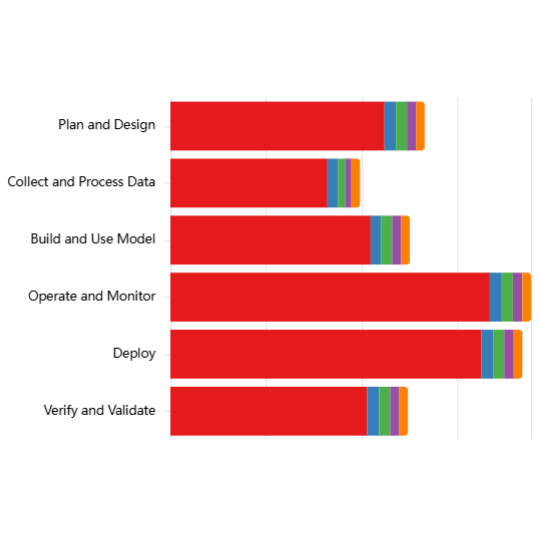
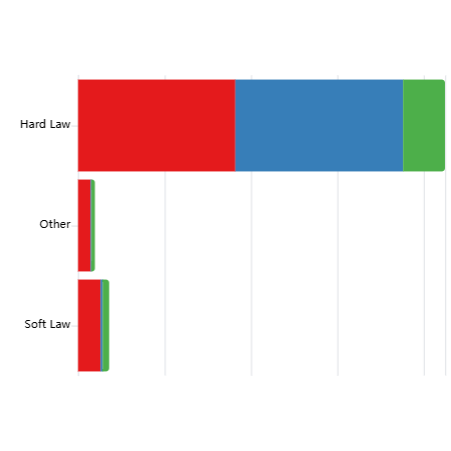
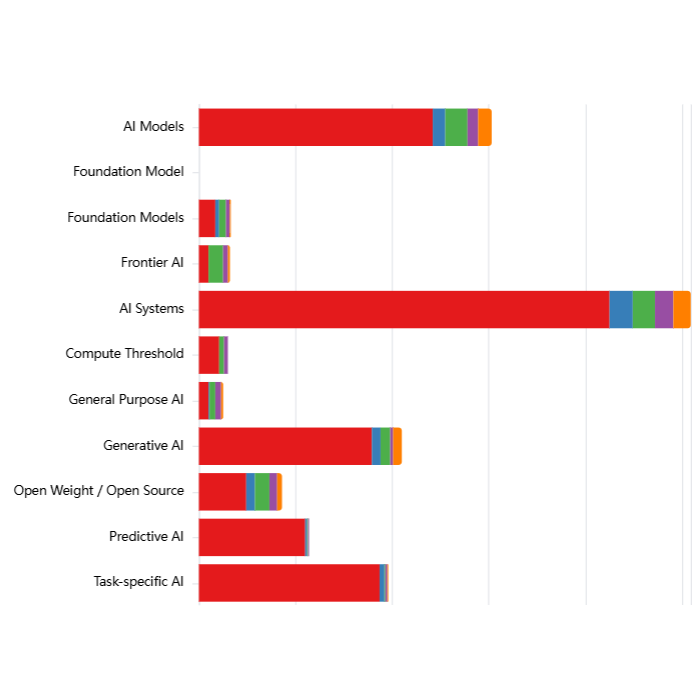
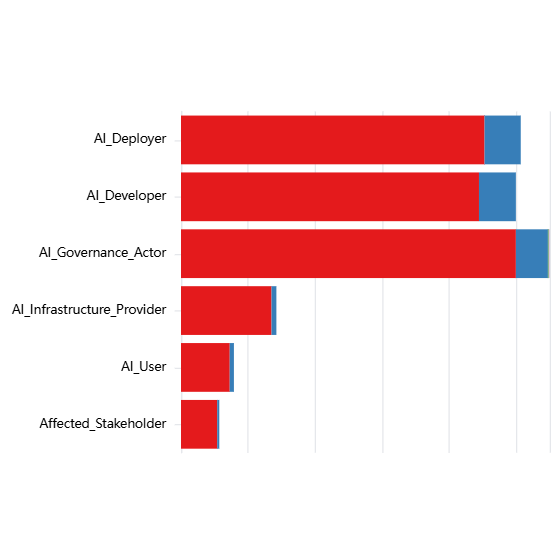
Explore the chart using the dropdown filters, and by clicking on category names (Jurisdiction, Authority, Legislative Status etc) to see distributions within each category or click on the preset example configurations below the chart.
Interactive Chart
[ { "label": "Documents with good coverage of each risk subdomain, broken down by Authority", "filters": { "coverage": ["3"], "stackBy": "authority" } }, { "label": "Documents with good coverage of each risk subdomain, broken down by Jurisdiction", "filters": { "coverage": ["3"], "stackBy": "jurisdiction" } }, { "label": "Documents with good coverage of each risk subdomain, broken down by Legislative Status", "filters": { "coverage": ["3"], "stackBy": "legislativeStatus" } }, { "label": "Documents with good coverage of each risk subdomain that primarily apply to Private sector", "filters": { "coverage": ["3"], "appliesTo": ["Private sector"] } }, { "label": "Enacted documents with good coverage of risk subdomains, mentioning Compute Threshold, broken down by Jurisdiction", "filters": { "coverage": ["3"], "activity": ["Enacted"], "technicalScope": ["Compute Threshold"], "stackBy": "jurisdiction" } }
]
Important context for interpreting these results:
The LLM classifications are based on the approximately 1000 documents in the AGORA dataset, which is predominantly composed of U.S.-origin English language government proposed documents, the majority of which are federal-level.
Coverage patterns described therefore reflect the priorities and framing conventions of this particular corpus and should not be taken as representative of the global AI governance landscape. We also found LLM classifications to exhibit some biases including over-attribution of coverage when governance-related language is present. Coverage scores should be taken as indicative of broad patterns rather than precise measurements.