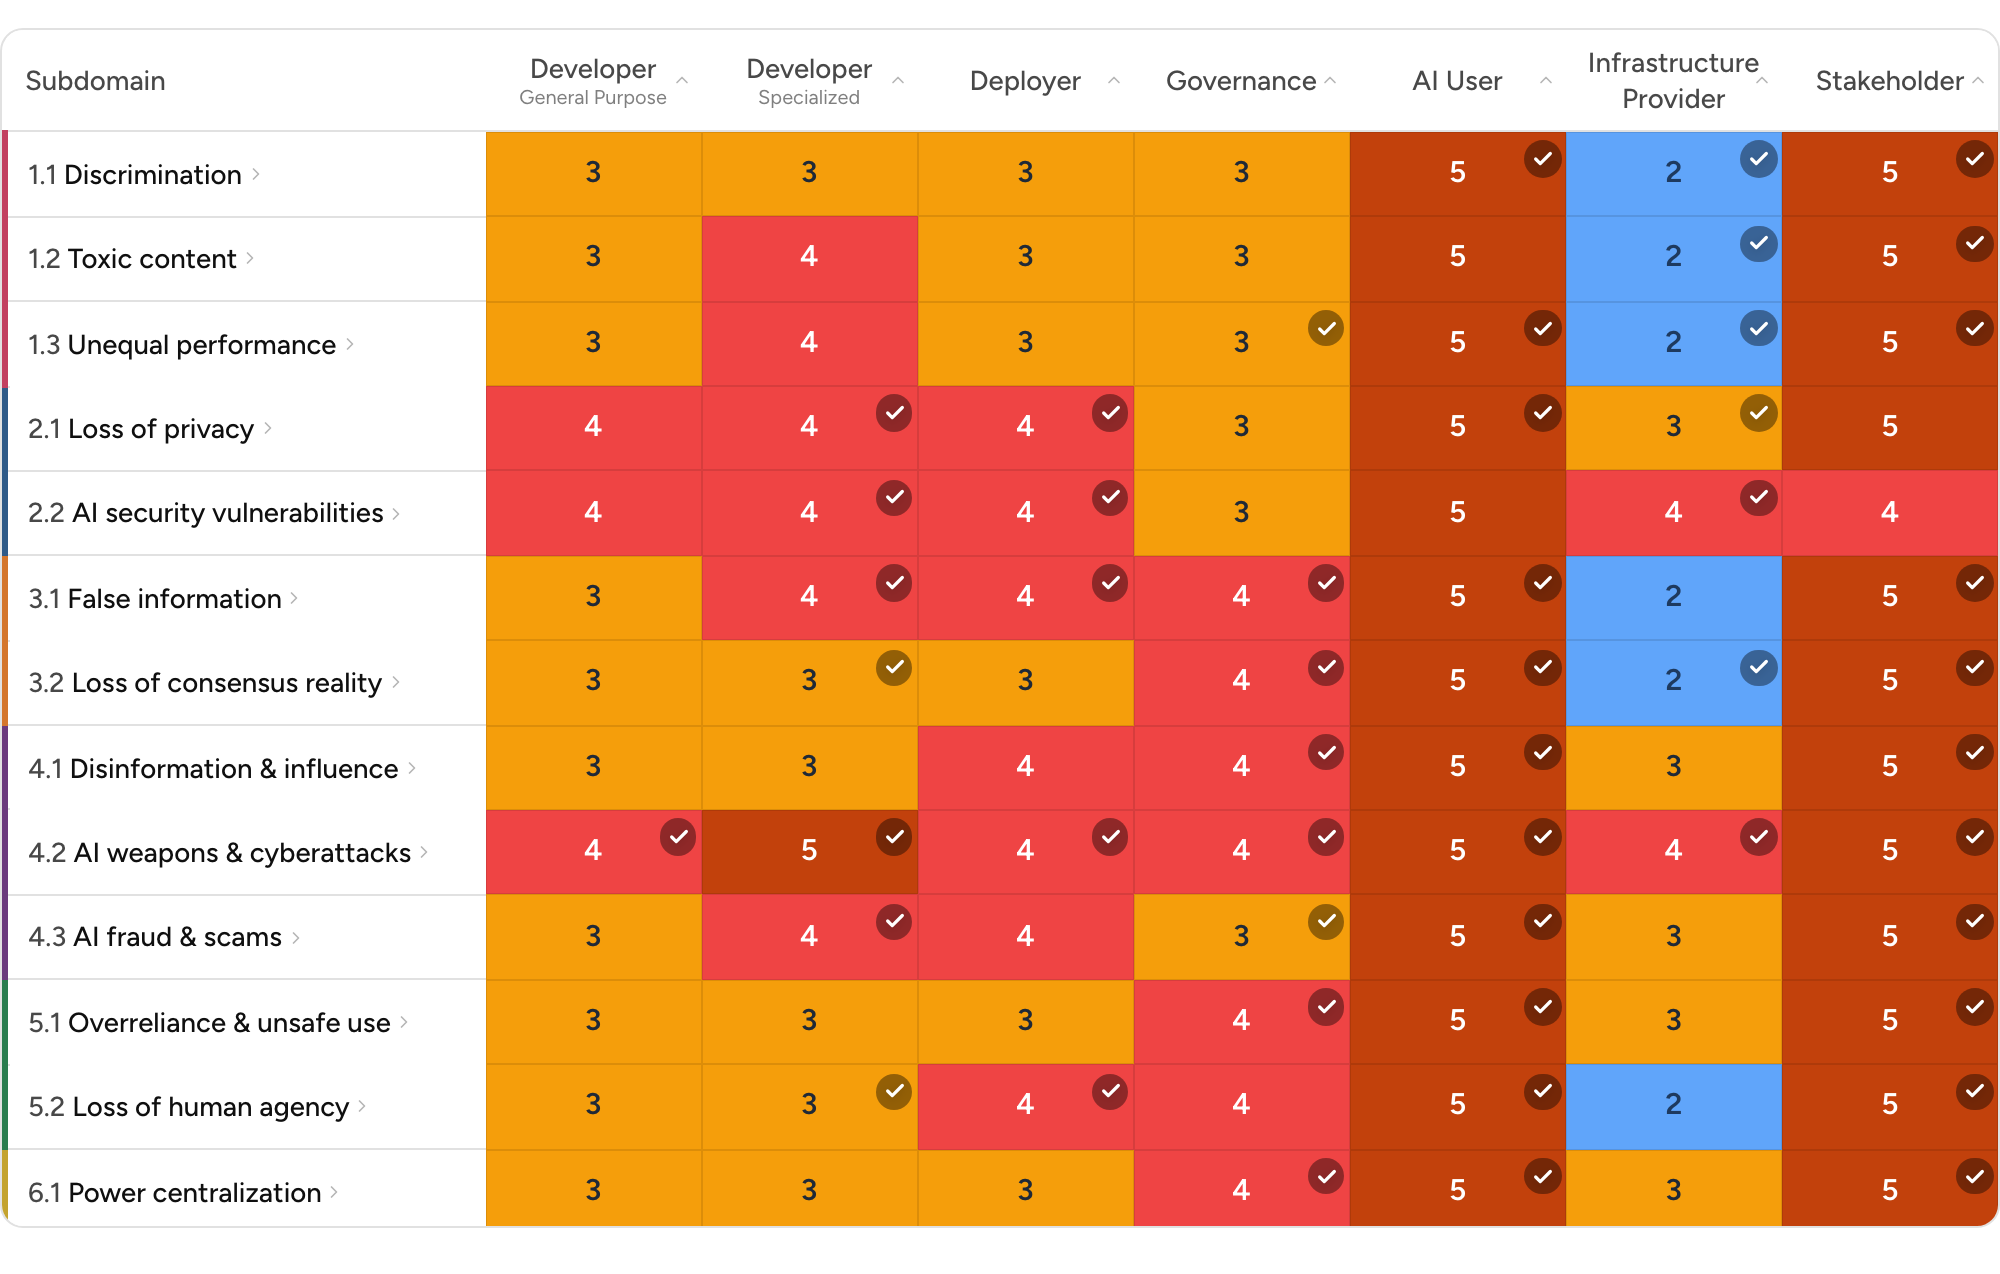
Rows represent risks and columns represent actor types. In each cell, the red bar (left) shows responsibility experts assign to that actor; the blue bar (right) shows vulnerability. Longer bars mean stronger expert agreement. Compare the two within a cell to see whether responsibility and exposure align — and scan down a column to see where an actor's pattern of responsibility and vulnerability diverges across risks.
Click through the links below to explore each priority risk.