.avif)
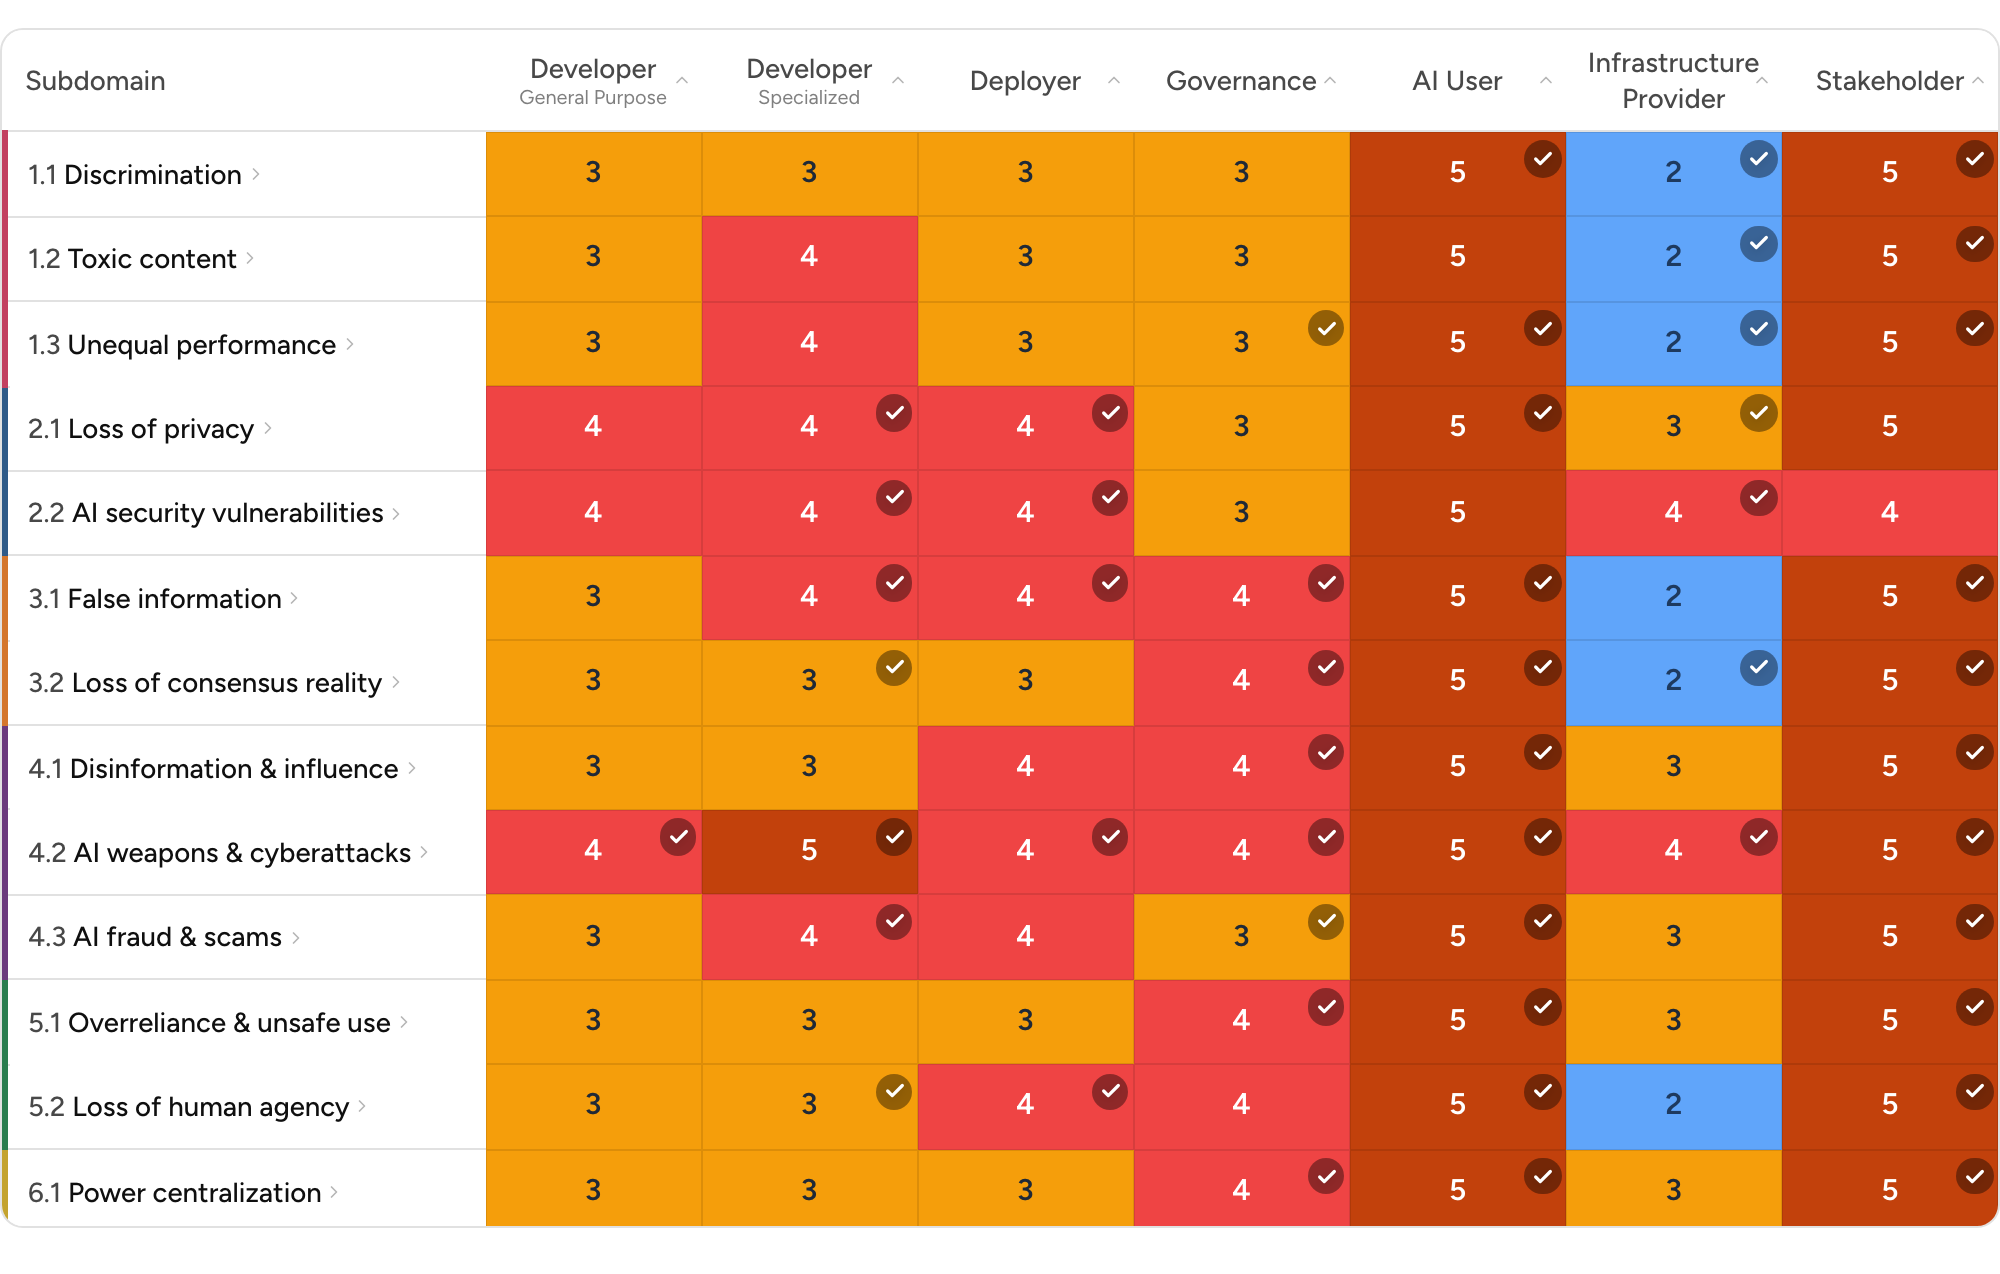
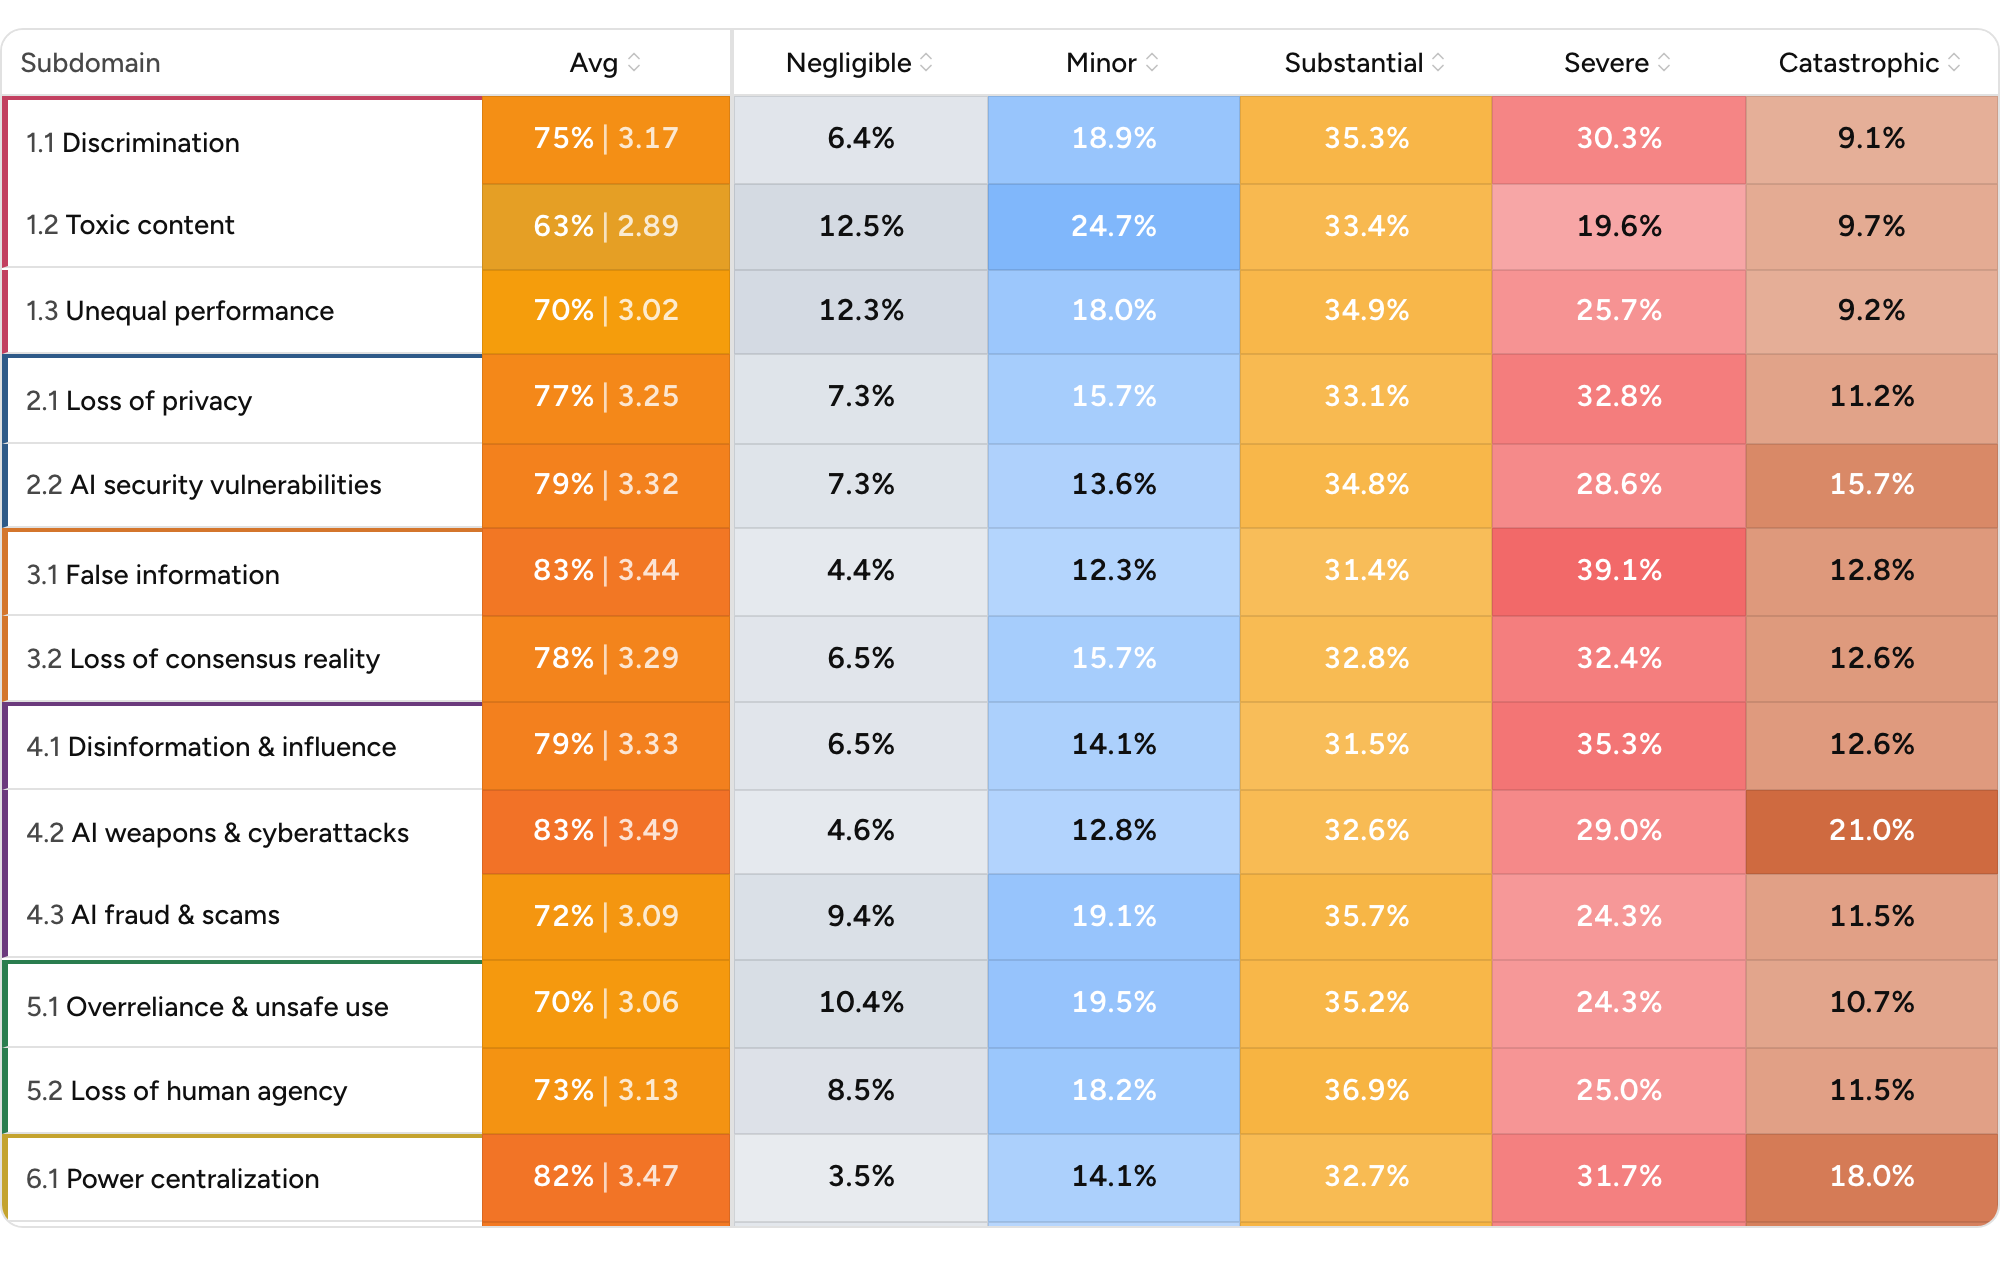
Each row is a risk subdomain. Bars show how experts rate the risk under Business as Usual — by default the percentage who chose Catastrophic, sorted from highest to lowest. Use View mode to switch the bars to a different severity level, the weighted-mean severity (1–5 scale), or the full distribution stack. Toggle Show mitigations to overlay Pragmatic Mitigations alongside BAU; a right-hand Change column then reports the PM − BAU shift, green when mitigations push severity in the helpful direction and red when they don’t. Switch Data view to cluster subdomains under their parent domains or show domain averages only, and click any subdomain row to open its full severity distribution.
Click through the links below to explore each priority risk.