AI Priority Risk View

Severity × Likelihood Scatterplot

Interactive matrix showing expert assessments of harm severity probabilities for all 24 AI risks. Explore detailed probability distributions across five severity levels with sortable views and expert commentary.

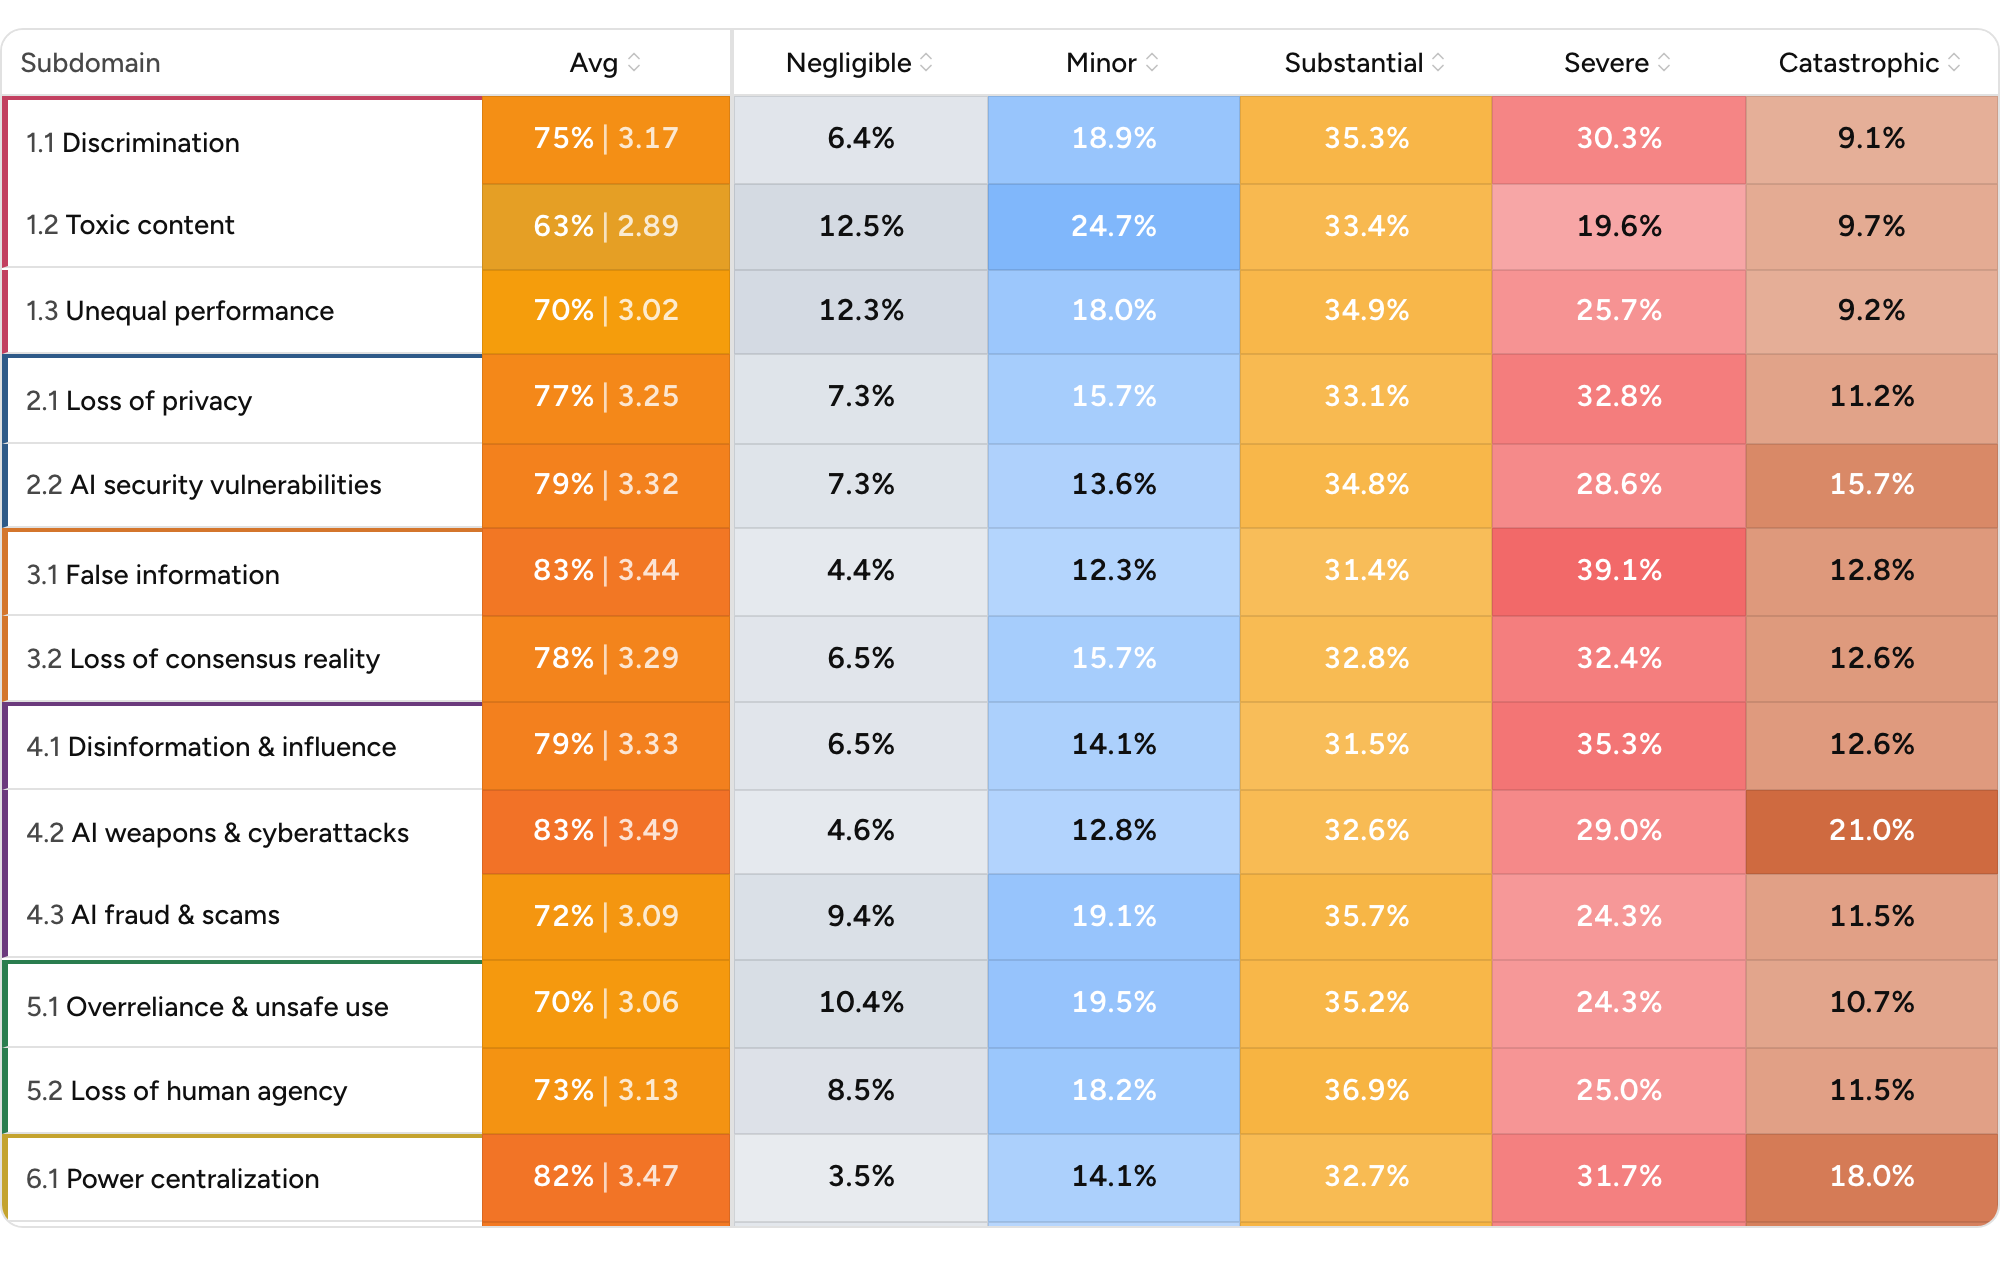
Each point represents a specific AI risk, positioned by its expected severity (x-axis) and likelihood of significant harm (y-axis) based on expert assessments. Points further up and to the right indicate risks that are both more severe and more likely. Filled vs. outlined markers show baseline vs. mitigated scenarios, with connecting lines illustrating how interventions could shift risk levels.

AI Ecosystem Actors

Understanding the framework used in this survey helps interpret the expert prioritization results. The following relevant sections explain the criteria experts used to assess risks, the AI ecosystem actors evaluated, and the industry sectors analyzed.

Industry Sectors

The survey evaluated vulnerability across 14 major industry sectors based on the North American Industry Classification System (NAICS). The following relevant sectors are:

Explore Other Risk Priorities

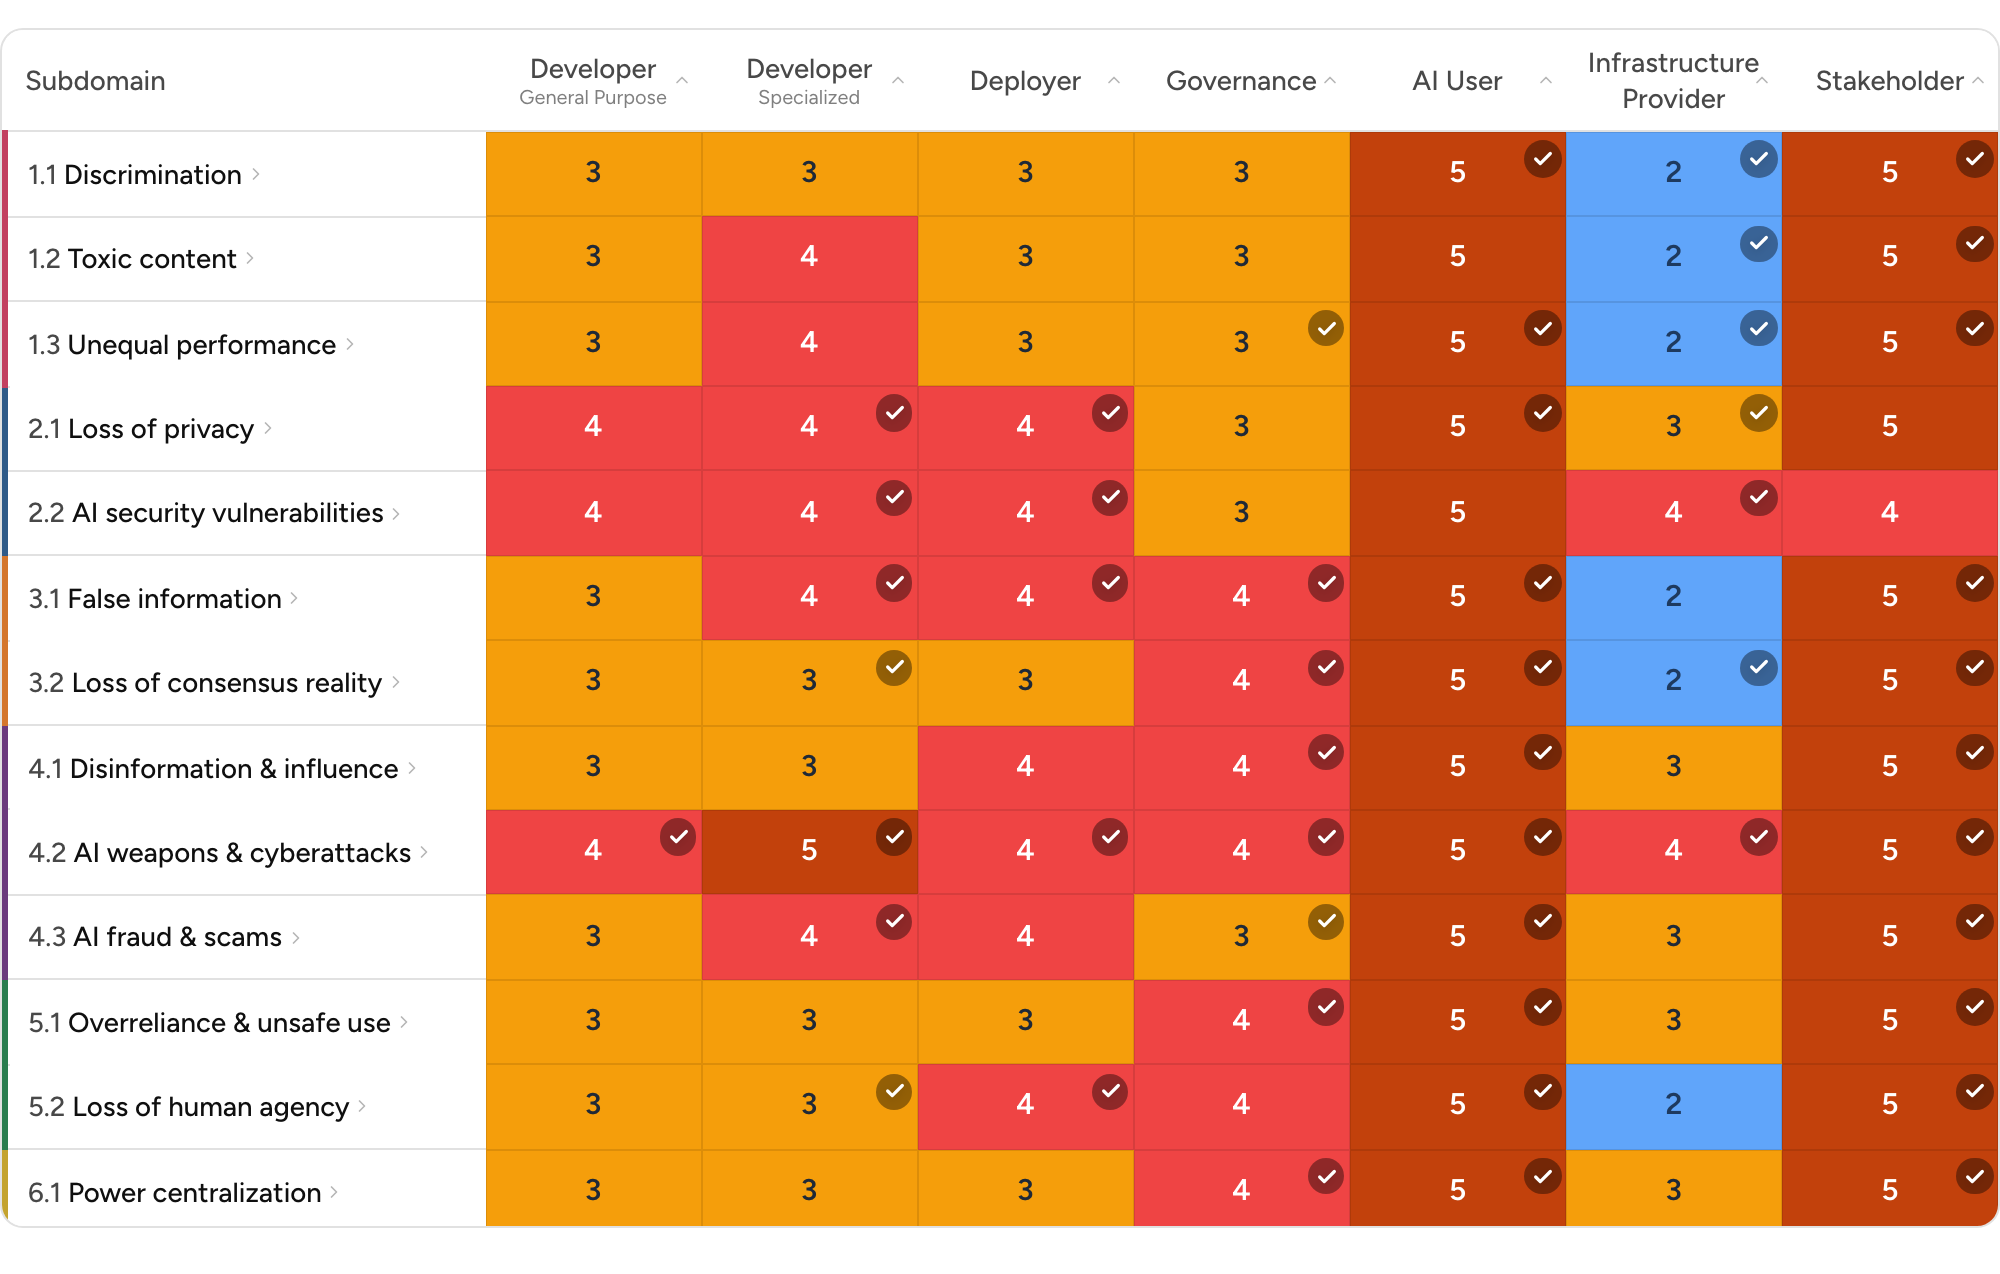
Click through the links below to explore each priority risk.