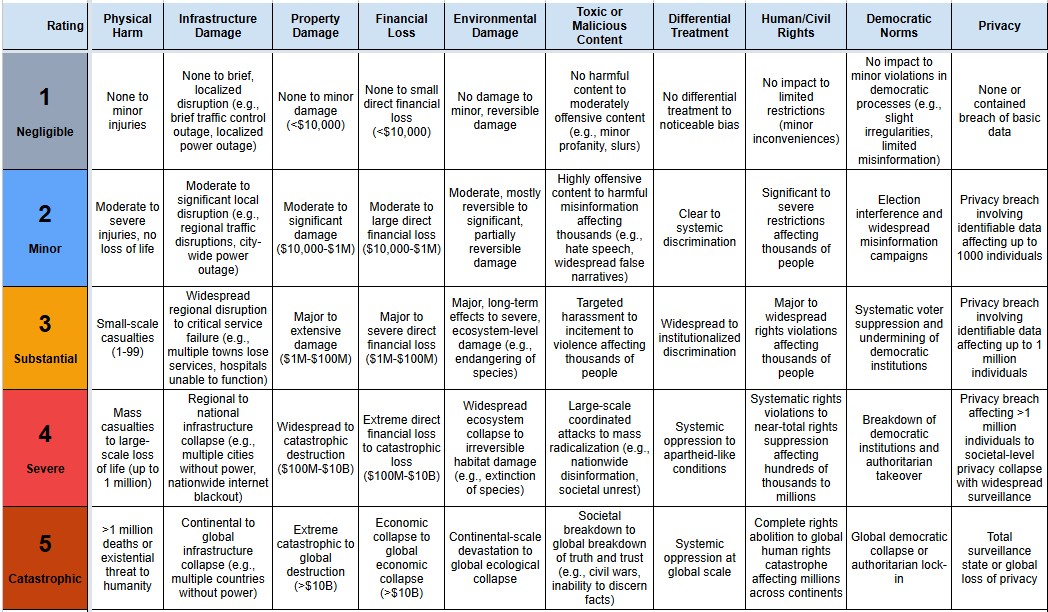
Using an LLM pipeline, we classified all the incidents in the AI Incident Database against the MIT Causal Taxonomy, the MIT Domain Taxonomy the EU AI Act Risk Levels and a harm severity scale covering 10 categories of harm.
Insights:
- There has been a clear rise year on year in the proportion of incidents in the following subdomains since 2022: 4.3 Fraud, scams and targeted manipulation, 3.1 False or misleading information
- The proportion of reported incidents attributed to lack of capability or robustness has been decreasing each year since 2021
- Numbers of reported incidents attributed to systems whose purpose is video, voice or image generation have increased dramatically since 2022, now totalling around half reported incidents.
- The proportion of incidents classified as level 1 (Unacceptable) under the EU AI Act has increased each year since 2022, reaching 4% in 2025]
- The proportion of intentionally caused incidents has increased each year from 2021-2025, as has the proportion attributed to Human rather than AI entities.
- The overwhelming majority of incidents assessed were classified as post-deployment with no more than a few percent being pre-deployment in any year.
Interactive Chart
Explore the chart by adding filters (e.g. Domain, Entity, Intent, Timing, AI Purpose etc) and stack by different categories to see the distribution of incidents in each year. Select incidents where any category of harm exceeded a severity threshold, or select harm severity thresholds for individual categories.
Multiple filters can be applied across all categories to build complex queries. If you are only interested in recent events, add a 'Year >=' filter.
The links below the chart quickly apply preset example filter configurations.
Click into charts to see lists of incidents matching the criteria.
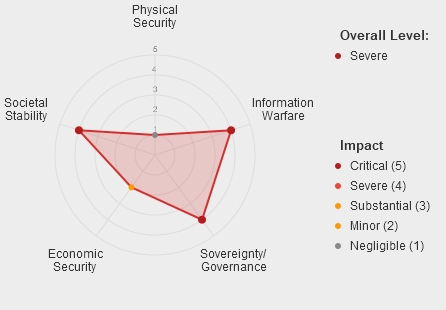
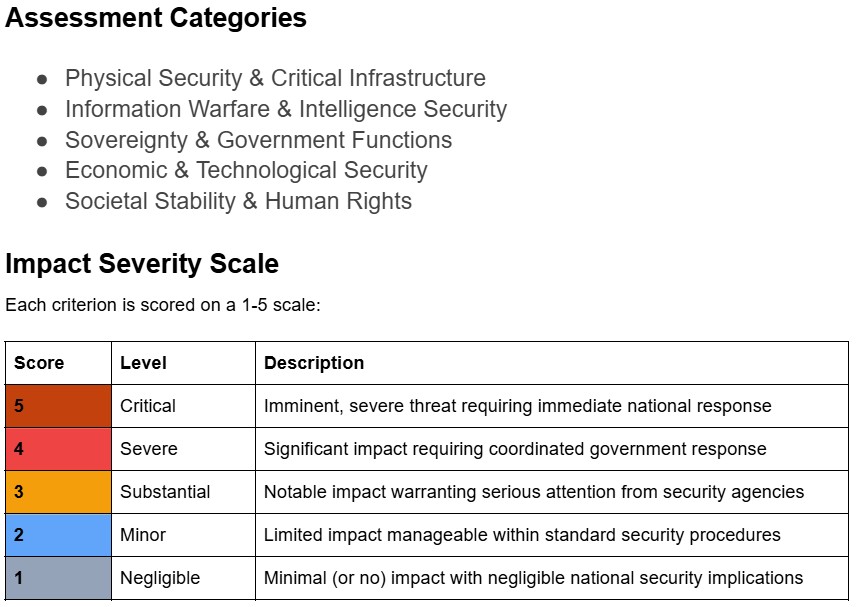
[ { "label": "Risk subdomains for incidents causing severe or catastrophic harm - viewed as a proportion", "filters": { "stackBy": "subdomain", "minSeverity": "4","viewMode": "proportion" } }, { "label": "Proportion of incidents associated with domain 1 Discrimination and Toxicity, caused by AI or by Humans", "filters": { "domain": "1 Discrimination & Toxicity", "stackBy": "entity", "viewMode": "proportion" } }, { "label": "Numbers of reported incidents meeting the EU AI Act's definition of High or Unacceptable Risk", "filters": { "euRisk": ["2 High Risk", "1 Unacceptable"], "stackBy": "euRisk" } }, { "label": "Severity of Harm Caused (highest rating in any category)", "filters": { "stackBy": "highestSeverity" }},{ "label": "National Security Impact (highest rating in any category)", "filters": { "stackBy": "natSecImpact" } }]
Preset filter configurations:
Important context for interpreting these results:
The data presented is the output of an LLM classifier pipeline applied to the raw reports from the AI Incident Database (AIID), which relies on submissions from the public and subject matter experts. The quality, reliability and depth of detail in the reports varies across the dataset. As the reporting is voluntary, the dataset is inevitably subject to some degree of sampling bias.
The LLM classification tool has been developed iteratively, and its agreement with human expert consensus is comparable to the agreement between 2 independent human experts (article forthcoming). Spot-checks have been used to provide feedback on misclassifications and to iterate the tool, improving its reliability, however there are likely to remain incidents where the LLM classification does not match expert consensus.
Therefore patterns and trends observed in the data should be taken as indicative and validated through further analysis.