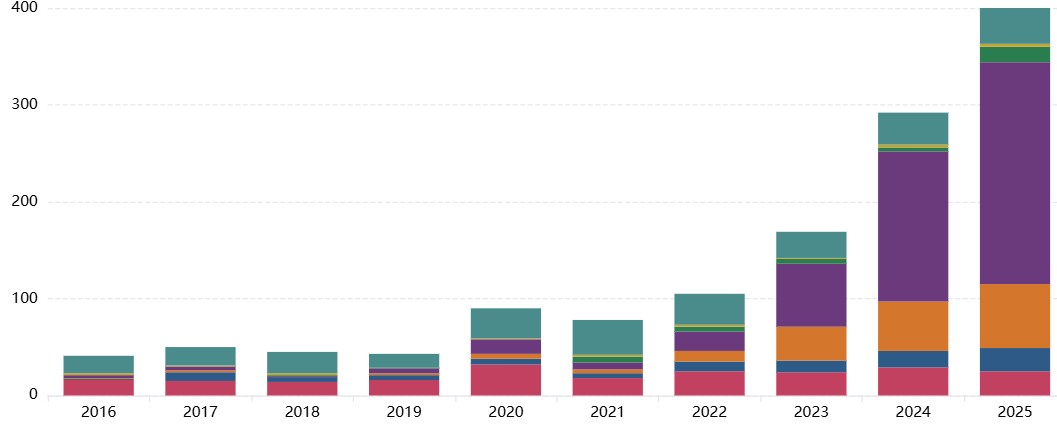
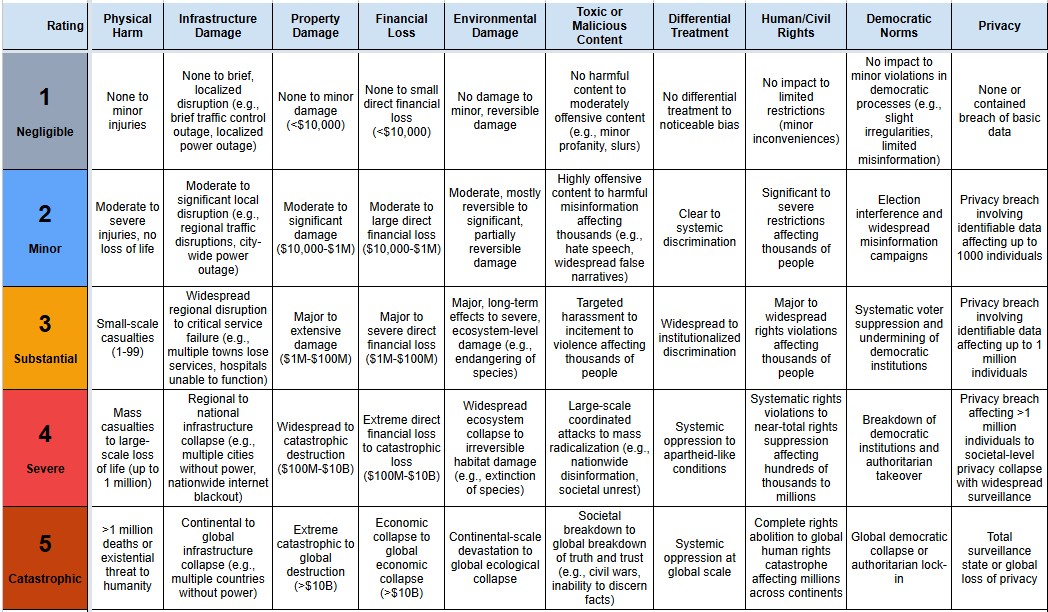
View detailed analysis of each incident in the AI Incident Database, including how the incident is classified, how severe the harm is, across 10 categories of harm based on this Harm Severity Framework and a list of possible causes identified by the model.
Complex queries can be built by adding filters across multiple categories.
[ { "label": "Malicious-actor incidents causing severe or catastrophic harm, most severe first", "filters": { "domain": "4 Malicious actors", "minSeverityHighest": "4", "sortBy": "highestSeverityScore", "sortDir": "desc" } } ]
Preset filter configurations:
Important context for interpreting these results:
The data presented is the output of an LLM classifier pipeline applied to the raw reports from the AI Incident Database (AIID), which relies on submissions from the public and subject matter experts. The quality, reliability and depth of detail in the reports varies across the dataset. As the reporting is voluntary, the dataset is inevitably subject to some degree of sampling bias.
The LLM classification tool has been developed iteratively, and its agreement with human expert consensus is comparable to the agreement between 2 independent human experts (article forthcoming). Spot-checks have been used to provide feedback on misclassifications and to iterate the tool, improving its reliability, however there are likely to remain incidents where the LLM classification does not match expert consensus.
Therefore patterns and trends observed in the data should be taken as indicative and validated through further analysis.