.avif)
What we are doing
What we have found
What comes next
Suggested citation
Peter H. Vartanian, Simon Mylius, & Peter Slattery (2026).
“From Incident to Intervention: Preliminary Findings on How AI-Incident Data(bases) Are Used—And What Should Change.”
Societies have long governed dangerous technologies by learning from past failures. The exemplary model for other industries today is commercial aviation: When NASA and the FAA decided half a century ago to prevent accidents by sharing reports of near misses, they established a confidential reporting system (the Aviation Safety Reporting System) that has since received more than 2 million reports from pilots, controllers, and mechanics. It has issued over 8,000 safety alerts but disclosed not a single reporter's identity. On the same wager—that a harm recorded somewhere becomes a harm preventable everywhere—medicine and nuclear power built registers of their own, with major documented safety improvements to their credit.
More recently, AI-incident data(bases) have gained recognition in international policy. On July 1, 2026, the UN’s Independent International Scientific Panel on AI released its Preliminary Report and observed that “expanding AI incident databases mirrors established safety practices in other mature, high-consequence industries.” The only databases that the UN cited were the MIT AI Incident Tracker, as well as the OECD’s AI Incidents and Hazards Monitor (AIM). Five days later, the Report was presented in Geneva to the first Global Dialogue on AI Governance, with most UN member states present. With that, AI-incident data(bases) have reached the tables of the Global Partnership on AI, the AI Safety Summits, the G7, and, now, the UN.
However, it remains unclear how well incident databases meet users’ needs, as these vary greatly by task. While an AI policy advisor preparing a parliamentary briefing may only need one documented case to make their point, an actuary pricing AI-related insurance might need loss and exposure data to build their model.
In response, there have been calls for closer study of users’ needs: In October 2025, the AI Incident Database (AIID) launched its first user survey, explaining that it had "never surveyed [its] userbase to know what is most wanted." The European Commission, whose first annual review of the AI Act under Article 112 drew on the MIT AI Risk Initiative’s AI Risk Repository and the OECD’s AIM, recorded in May 2026 that, since incident databases "publish only brief summaries of reported events," its analysis "relying on these sources was to a certain extent limited.” In a study by RAND and GovAI of how such systems should be designed, the authors propose "practitioner interviews, user experiments, and industry surveys to explore these dynamics in practice." Similarly, a security-incident taxonomy written jointly by Microsoft, Palo Alto Networks, Germany's BSI, IBM Research, and, among others, the AIID itself calls for “usability studies.” CSET’s Executive Director Helen Toner—a former OpenAI board member—compressed the whole matter into one sentence in 2024: "We know so little about how AI systems are actually being used in practice, and data on where/when they cause problems is super sparse."
Despite these calls, the lessons of putting AI-incident data to work had never been systematically collected across the ecosystem. To address this gap, we consulted 45 practitioners through spoken consultations and written exchanges. The five findings show where institutions encounter difficulties in interacting with incident data. These findings then inform the recommendations for database maintainers and the practical implications for AI deployers, funders, and lawmakers.
Parenthetical references R1–R6 and N1–N3 connect the findings to the recommendations and non-recommendations.
Consultees described evidentiary requirements that differed even among practitioners in the same sector. A database may serve one task well but lack the evidence that another requires.
One AI-policy adviser, for instance, wanted a documented example of AI deception for a parliamentary briefing. By contrast, an actuary working with reinsurance companies told us that developing premiums for AI-related policies required loss and exposure data alongside accounts of individual failures. Yet, a common thread emerged: Over two-thirds of consultees raised needs for incident data selected and presented for particular tasks—for example, as sourced case summaries, comparison tables, or detailed records for investigation (R1).
Those requirements also differ within insurance. Describing its value chain as “Byzantine,” a researcher in AI underwriting explained that actuaries use loss models to establish a price range. Underwriters then select a price within that range after assessing the policyholder. A jailbreak report may offer little for pricing if it does not quantify a loss, yet still prompt an underwriter to ask whether a prospective policyholder could prevent the same failure. Grouping actuaries and underwriters together under “insurance” would obscure these different uses of incident data.
A larger collection does not necessarily supply the detail that a particular task requires. A quantitative-AI-risk modeler favored transcripts of an AI agent’s actions and interactions for reconstructing a particular model’s attack sequence. When assessing whether the lists of prohibited practices and high-risk uses needed revision, the European Commission’s 2026 review of its AI Act drew on 3,791 incidents reported in the OECD’s AIM between January 2024 and May 2025. Brief summaries often lacked enough detail for precise classification under the review’s analytical framework, leading the Commission to use broad quantifying terms instead of precise proportions.
One consultee formulated a test for turning classification into intervention:
Give [a request for an intervention] to someone who has not classified [the AI incident] themselves. Can they tell what needs changing? Could they tell you which evidence would show [that] they fixed it? Imagine getting a repair ticket that says, “plumbing.” Okay, but where is the leak? […] And the person receiving it could send it back with a question. Keep that question! Because, after all, what is missing is not another label on the ticket—they need to know which pipe is leaking [...] and what to do about it.
— An engineer investigating AI incidents in the creative industries
Consultees described incidents that were known to practitioners but absent from public databases. Such absences could reflect deliberate nondisclosure or delays in reviewing reports, in addition to the sheer geographic and linguistic limits of collection. Consequently, uneven coverage could skew users’ conclusions about the distribution of harm.
Researchers affiliated with India’s communications and defense ministries compared AIID and AIAAIC to assess how incident reporting could support the UN SDGs (esp. SDG indicator 10.3.1 on self-reported discrimination and harassment). Their May 2024 snapshot placed 536 of AIAAIC’s 905 entries (59.2%) in the US, UK, and China. Separately, Cambridge researchers examining the AIID observed that submitted reports came almost exclusively from one language: English. These collections are extremely vulnerable to geographic and linguistic biases, leaving users with less evidence about AI-related harms in other parts of the world, especially those reported mainly in local-language sources.
A strategist working on AI governance in Africa encountered the problem directly: Searches returned material about African Americans, while regional networks, including fact-checkers, proved more fruitful for finding relevant cases. But broader sourcing still depends on what others are willing to disclose. A regulator monitoring AI’s CBRNE and cyber risks described failures and near-misses that are known inside companies but may never reach public reporting. For a nuclear non-proliferation adviser working on AI in nuclear command, control, and communications (NC3), "that silence [was] strategic": To disclose a near-miss could amount to admitting that a state's deterrent was vulnerable. Selective disclosure can introduce reporting bias, since missing reports may reflect a decision to withhold information as much as a failure to collect it.
Even publicly available information may reach a database largely through the work of a few people. In the AIID–AIAAIC comparison, four named individual submitters accounted for 320 of the AI Incident Database’s 657 reported incidents, or 49%. Once submitted, reports still require editorial attention, which maintainers described to us in terms of "manual checking" and "backlogs." An apparent gap in reported harms may reflect such a backlog rather than an absence of harm, with the information available but the incidents not yet investigated (Figure 1, stages II–III). A user who can separate such delays from failures of disclosure or collection knows what an apparent absence is worth.
Several respondents reported that incident classification is a highly subjective process and varies by the coding system and coder involved. As a result, the same incident may be coded differently within different systems or within the same system by different coders.
For example, assessors must decide whether AI contributed to the harm at all (see Figure 1, stage III). A designer of AI taxonomies recalled data in which the AI system was “kind of there, but not really involved”: Presence alone does not establish a contribution to harm, as assessing that contribution also requires examining the user’s role.
A former national-security litigation analyst wanted evidence of AI’s “uplift potential”: what it added to propagandists’ existing capabilities. She discussed a fabricated video that pro-Iran accounts had circulated, observing, “You could have made that video without AI.” She therefore wanted to know whether AI made such videos cheaper to produce or enabled more of them to be made. More broadly, she challenged the assumption that serious harm abroad necessarily amounted to a grave threat to the United States, citing the primary-school strike in Minab, Iran. An internal Pentagon review reportedly attributed the strike as being partially due to overreliance on the Maven Smart System, which had recommended the school as a target because of outdated intelligence, although other others attributed the failure mainly to bad data. Since our consultation, the ratings of both The fabricated data and strike have been revised, but her concern went beyond the scores to the judgments behind them. Neither a rating of national-security significance nor the scale of an official response establishes how badly people elsewhere were harmed.
Classification also required deciding which harms and affected parties to include. The designer’s team annotated roughly 200–250 incidents over more than a year, with weekly discussions of what counted as harm and who was affected. A data scientist specializing in AI-failure analysis outlined a “tripartition” into primary (direct), secondary (indirect), and tertiary (wider societal) harms.
Assessors then had to judge how badly each affected party was harmed within the relevant local context. Illustrating this, one consultant on AI in Indian public services told us that even a farmer’s loss of ₹100 through an AI system could undermine trust in it.
Thus, neither does a small monetary loss imply minor harm, nor does a fixed scoring scheme dispense with judgment. When two reviewers in our June 2026 pilot validation of the MIT AI Incident Tracker each assigned 100 harm-severity sub-ratings across ten incidents, their quadratic-weighted kappa was 0.31, indicating limited agreement in this pilot. Understanding the disagreements requires examining the reviewers’ reasons. As the engineer investigating AI incidents in the creative industries warned, sometimes “the dropdown has made the decision for everybody.” A category can settle a disputed judgment by concealing the alternatives. Traffic-light (i.e., green–yellow–red) thresholds are similarly contested: A war-gamer who had worked in national laboratories described their negotiation as “norming and storming,” adding, “It’s mostly storming.” Even agreed-upon thresholds may be calibrated to familiar harms, prompting his caution “We might not have seen red yet,” though consensus on what counts as “red” may itself change over time.
Consultees who sought to estimate the frequency of AI-related harm distinguished the number of reported incidents from the rate of harm per unit of AI use. Wider deployment could produce more incidents without increasing the risk per use. Even if the number of incidents remained unchanged, greater public attention could increase reporting.
For example, an AI evaluation researcher at a U.S. standards agency wanted to distinguish changes in risk from shifts in public attention by “correcting for buzziness.” The question posed to us by database users seeking to quantify risk (e.g., actuaries, underwriters, insurers, and assurers) concerned the denominator: How much AI use had generated the reported incidents? One actuary with a background in longevity insurance and statistical risk wanted rates expressed as "incidents per million agent-hours," with the combined operating time of AI agents in a defined sector as the exposure denominator, and losses reported beside it for pricing. Read without its denominator, a trend in incidents is only a trend in reports (R6, N1).
The denominator also governs interpretation—one 2026 media analysis by the OECD found that cyberattacks and fraud rose from about 4% of AIM’s reported incidents and hazards in 2022 to almost 10% in 2025. Since the denominator is the full collection, those percentages describe its changing composition. Estimating changes in the risk of AI-enabled fraud would require exposure data and an account of reporting. The same denominator problem arises in mandatory reporting on automated vehicles: In June 2022, the U.S. National Highway Traffic Safety Administration (NHTSA) released data on 130 crashes involving automated-driving-system-equipped vehicles without adjustment for fleet size or miles traveled.
The numerator also depends on what counts as one incident (see Figure 1, stage IV). The AI evaluation researcher asked whether one episode involving a security firm and two AI models should count as one incident or two. The NHTSA describes a related counting problem: One crash may generate initial and updated reports from several entities. Counting each report as a separate event can therefore inflate the total through duplication bias. Conversely, one account may encompass severe harm(s) to many people.
An ML scientist studying deepfake harms described how to use records of complaints from the same sources over time, keeping each source’s counting rules consistent. Building on that proposal, we could establish a common counting unit and period, then match cases across sources and use capture–recapture methods to estimate the number of cases not recorded by any of the sources. In the simplest model, less overlap between two lists of a given size implies more cases missed by both. The estimate depends on how cases reach each source: Referrals between sources, for example, can distort the result. Representative victimization surveys, which ask people about harms whether or not they reported them, could provide an independent check.
Consultees described how advisers used incident data to brief decision-makers who did not consult the underlying database. Yet the qualifications that accompanied the data could be lost in successive summaries.
Along an institutional stovepipe, the more junior “intermediary” (whoever relays the data instead of directly using it; e.g., an assistant or aide) may retrieve incident data for the more senior advisers or consultants to assess before a briefing reaches its recipient. A senior UN diplomat warned against imagining the UN as “one person with one inbox,” explaining that “at the ambassadorial level, the interface is often a human.” By the time that an incident enters a more senior official’s deliberations (Figure 1, stage V), the briefing may draw on the original database without citing it.
Because an assessment must be defensible to the ultimate decision-maker, the data must keep their provenance and qualifications through every handover (R4). For an adviser citing an incident in a briefing, this means explaining what the available data warrant, since scrutiny can expose uncertainty that a compressed summary has hidden. Our reinsurance actuary pointed to Lloyd's 2022 requirements for state-backed cyber-attack exclusions, which made attribution to a state a contractual matter on which cover could turn. For the diplomat, the same demand governs public statements, where an institution may have reached a judgment internally and still decline to disclose it.
Some contributions leave a public trace: One AI expert discussed how outside expertise informed Costa Rica’s 2023 position paper on international law in cyberspace. Much of the preparatory work that our UN consultee described, however, would remain inside the institution—beyond a database maintainer’s view. Visits and citations alone may not reveal an intermediary who used incident data to advise a decision-maker who never opened the database. An absent citation does not establish non-use. To assess influence more directly, we could follow the data into the briefing and ask: Would the advice have changed without them?
The consultations generated recommendations for database maintainers and identified practices to avoid. Complementary priorities in §6 address work that depends on resources or authority beyond maintainers’ control. §8 and Appendix D explain the scoring.
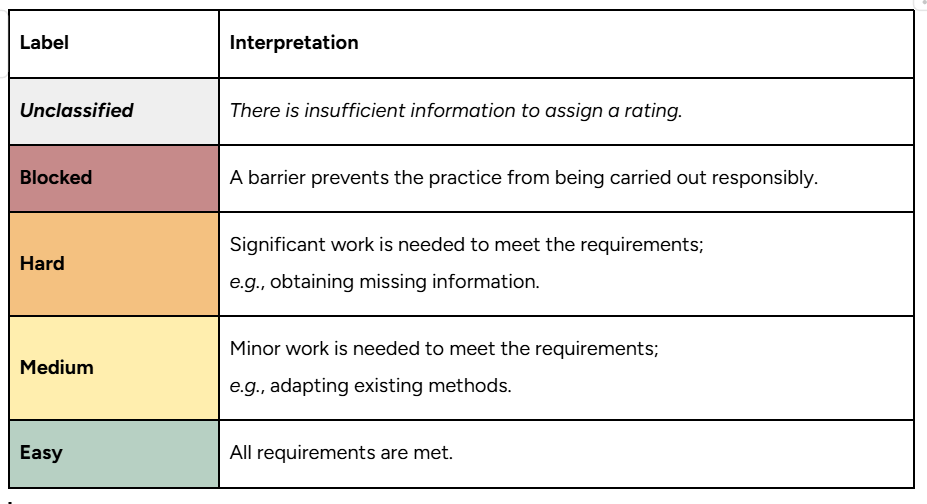
Table 1 summarizes our six recommendations for AI-incident database maintainers by expressed need (Demand) and the feasibility of implementing and sustaining each recommendation (Deliverability). The Demand column shows how many consultees described needs that each recommendation could meet. Table 1 presents the reconciled counts, with darker shading indicating higher counts. Alongside these counts, the table identifies the work still needed, while Deliverability reflects maintainers’ confidence in meeting those requirements (Appendix D.2).
Table 1. List of recommendations
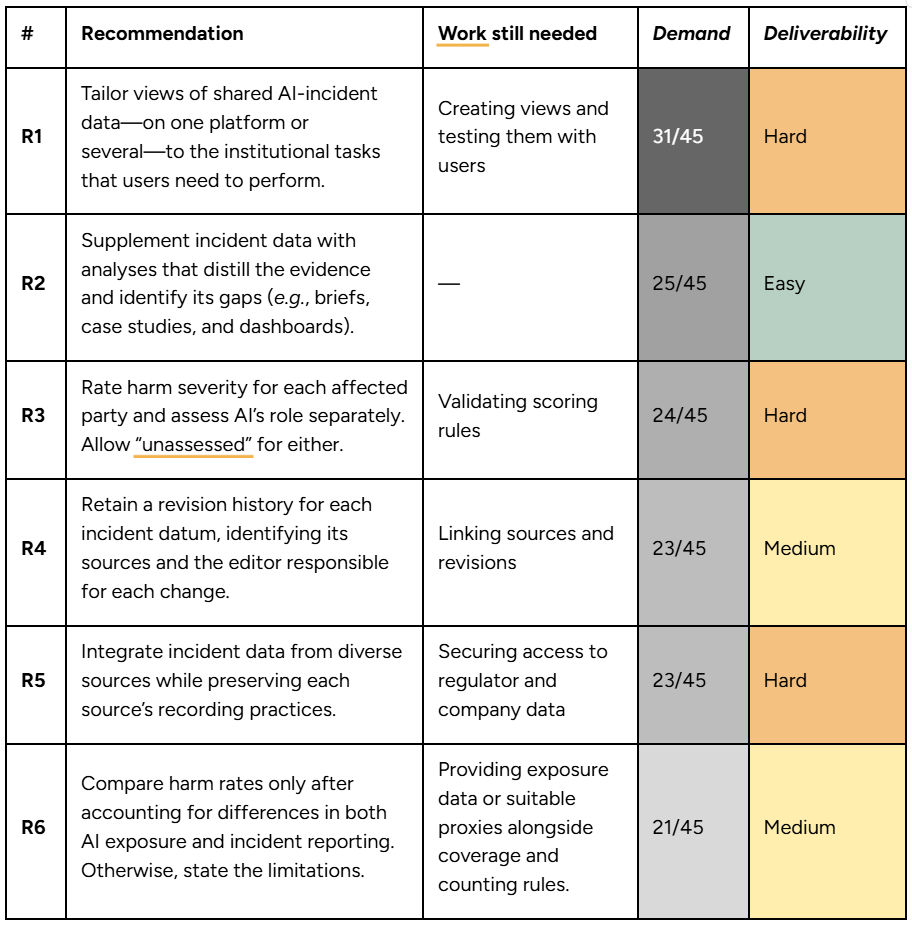
The following examples elaborate on several of these recommendations. R2 and R4 could also support the casebook proposed in §4a by making its analyses usable and traceable.
A threat modeler at a frontier AI lab wanted investigative reporting that recovered “the full richness of the situation,” showing how far an attack progressed and what it affected. Written analyses and briefings can make the available evidence usable, and its gaps apparent, for deciding whether (and, if so, how) to intervene (R2). Beyond serving their immediate audience, they can inform how maintainers design task-specific views over the longer term (R1).
Severity ratings deserve particular scrutiny when they determine which incidents receive attention. Before using ratings to rank cases or trigger alerts, maintainers should test whether disagreements would change those priorities and revise the rules where necessary (R3). Users must be able to trace an assessment to its sources and follow its correction (R4). Because data often reach decision-makers through intermediaries (§2e), the data for each incident should have a stable link and an identifiable version, so that readers can recover the assessment available when a briefing was prepared.
A more diverse “smorgasbord” of sources, as one consultee put it, is “highly desirable” yet also creates continuing editorial work. When pursuing access to missing data, maintainers should secure the capacity to check and update new contributions (§2b; R5). Otherwise, collection can expand faster than the capacity to make the data usable.
We also identified practices that we advise against (see Table 2). The Support column indicates how many consultees provided grounds for each non-recommendation. Red denotes Blocked, with darker shades indicating more Support.
Table 2. List of non-recommendations
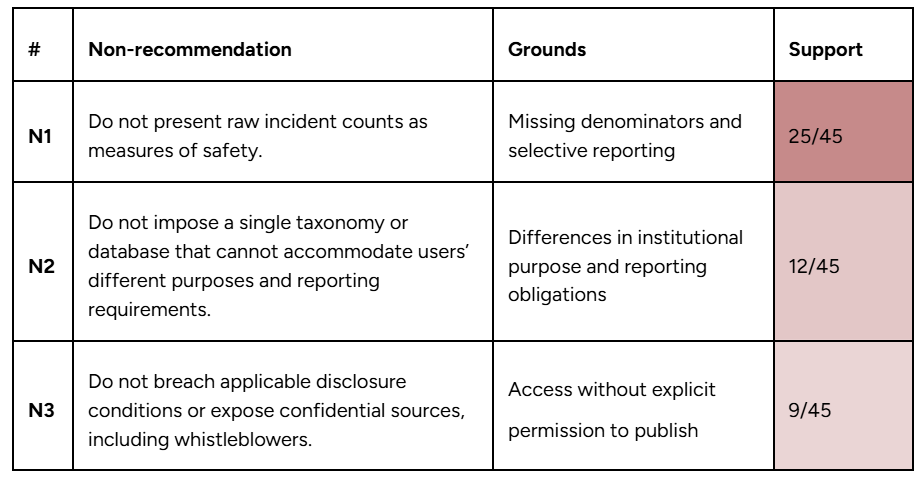
Readers may draw conclusions from league tables of reported incidents before checking their footnotes: "Too many people read shapes and skip captions," as a threat-intelligence specialist at a think tank put it. Maintainers should therefore state coverage limits beside the numbers and use comparable denominators before comparing harm rates (R6, N1).
Maintainers should test whether shared incident identifiers and crosswalks between categories let users find comparable cases across databases, then judge from those results whether a common schema is needed (N2). To support those comparisons over time, the crosswalks must show where categories overlap or differ and track changes in the classifications.
Confidential reporting should begin with an agreement with contributors on who may use the data and what may be published, including any reports or statistics derived from them (N3). Because such outputs can expose protected information even when the source data stay private, maintainers should check them against the agreed terms, ask whether their details could identify a whistleblower or other confidential source, and budget for that review.
The findings identified several difficulties in turning incident data into grounds for intervention. We bring these difficulties together in Figure 1, which formalizes a process model developed through the consultations and subsequent exchanges (Appendix A.1). This model shows where the recommendations in §3 could help institutions investigate incidents and then decide how to respond. Its feedback paths extend beyond the findings to a hypothesis about learning across incidents:
Figure 1. Toward a cycle of learning from AI incidents
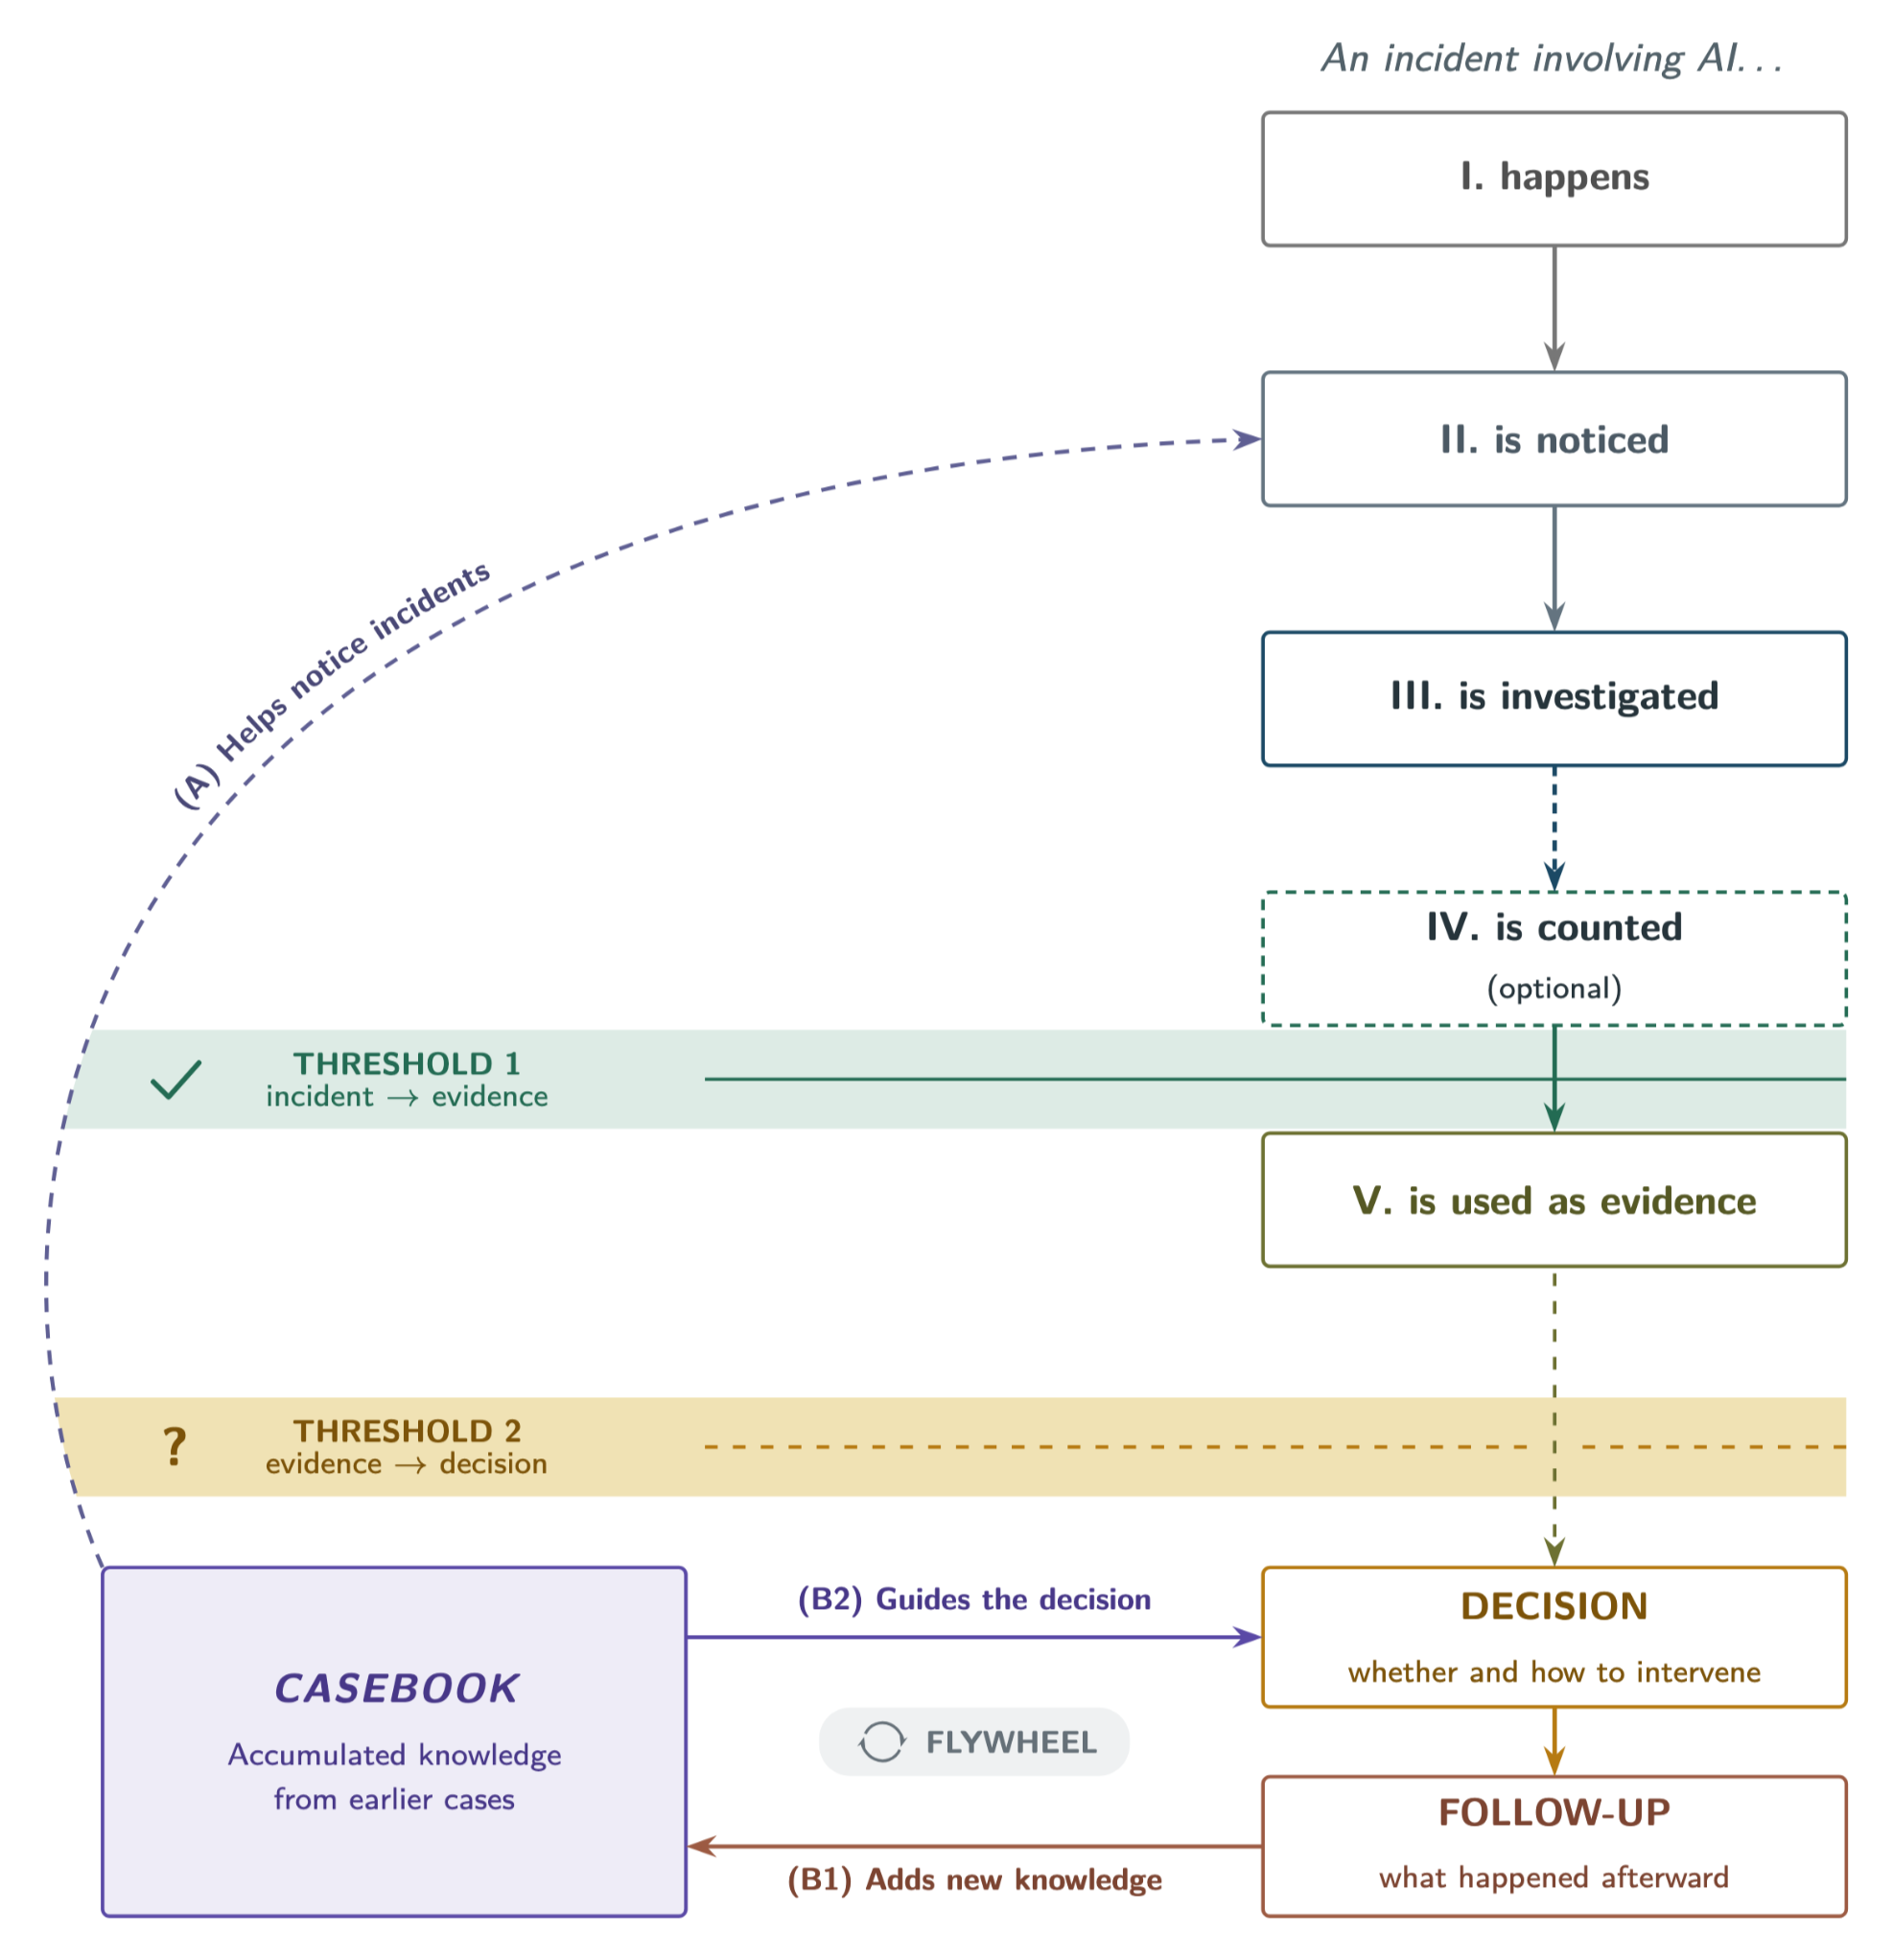
In stages I–V, the model traces how incidents become evidence through the investigation of individual cases or comparison across multiple cases. It draws on the problems of coverage, classification, and counting described in the findings.
The task-specific demands and the need for defensible assessments inform two decision-making thresholds:
But crossing Threshold 1 does not settle the judgment required at Threshold 2. That is, institutions can agree on the evidence but follow different rules for intervening. Already, the world’s various AI Safety Institutes (AISIs) leave the use of joint international risk assessments to national discretion.
To help institutions learn from one another’s decisions, we propose a casebook documenting institutional responses to AI incidents. Each account would explain the judgments at both thresholds, including how the institution’s jurisdiction, legal mandate, available powers, and local circumstances informed its decision to act or not act. Entries in the casebook should also explain how any restrictions on using evidence received from abroad affected the decision to intervene (N3).
Sharing findings about the effects of those responses—among institutions, across borders—would add much-needed evidence to the accumulated knowledge (B1), which institutions could draw on when deciding how to respond to similar cases (B2). Earlier cases could also help them recognize later incidents (A). This is the potential flywheel developed below: Each institution’s work could make the accumulated knowledge more useful to the next.
Our consultations showed that users need to know how assessments were reached before deciding whether to use them. We hypothesize that institutions can learn from previous investigations on similar terms: The record must explain why a response was chosen, including decisions against intervention, and show what followed.
Our proposed flywheel starts when an institution uses relevant cases to identify which earlier findings apply to its circumstances and what it still needs to investigate. Findings from that investigation then enter the casebook, extending the evidence or correcting an earlier account (Figure 1, B1–B2).
Prior learning can strengthen an institution’s absorptive capacity: its ability to recognize the value of outside knowledge and put it to use. Institutions of all kinds can also learn from one another through experimentalist governance, which empowers them to compare interventions and revise the rules that guide them. For regulators, this could mean adapting a response tested in another jurisdiction to their own legal powers and the conditions in which the system is used.
Countries need the capacity to produce evidence of their own to help shape international AI standards. The casebook could support that capacity by preserving enough detail for institutions to re-examine findings in light of their questions. Even when institutions share an assessment, however, their agreement alone does not independently corroborate its findings. Separate investigations may also reproduce the same blind spots if they use the same tests. In light of later incidents, re-examining earlier safety evaluations could then reveal which failures went undetected. And in that re-examination, evidence from local deployments could even help the casebook address the geographic and linguistic gaps described in the findings.
The casebook could build on Cambridge researchers’ examination of 4,743 AIID reports on 962 incidents, which traced how institutional responses varied according to who suffered harm. To establish what those responses achieved, organizations deploying AI could report what happened after corrective action, as recommended. Assessing changes in harm rates would still require the exposure data and reporting adjustments discussed for automated vehicles (R6, N1).
Beyond the reasons at each threshold, each casebook entry should record:
What would keep the flywheel turning—or stop it? Regular policy reviews could give institutions “a reason to return,” as our UN diplomat put it, to reconsider earlier findings in light of the outcomes of interventions. A monitoring framework coauthored by members of our MIT team proposes a shared repository of answered monitoring questions whose sources and assumptions could support that re-examination. With each version of an analysis retained (R2 and R4), readers could then judge whether those outcomes justified revising an assessment. The strategic silence described could, however, keep institutions from reporting interventions that failed. Testing the flywheel would need to account for that selective reporting when assessing whether the revised records improve later investigations and the interventions that they inform.
Our most self-evident limitation is uneven professional coverage: Those managing AI risk within firms (Deployers) account for just two consultees. Appendix B defines these functions, and Appendix C shows their representation. Given this uneven coverage, using our counts to infer how priorities are distributed across the wider ecosystem would risk a sampling bias.
The Deliverability ratings reflect a collective self-assessment by our team and other database maintainers of what would be needed to implement and sustain each recommendation (Appendix D).
Our recommendations offer limited guidance for highly specialized tasks whose data needs remain underexplored. An agricultural researcher, for example, lacked the funding and time to study AI risks for farmers and food security. Consultees also suggested adding a ninth professional function, Adjudicators (see Appendix B), for deciding contested claims of AI-related harm. A comparison of U.S. federal court opinions with the AI Incident Database found that incident classifications do not map directly onto the claims litigated in court. Studying which data are needed to establish legal responsibility would extend our research beyond Assessors’ risk assessments and Regulators’ oversight.
Another limitation concerns our (geo-)political reach, including access to institutions in China, Russia, and Belarus and to restricted security communities elsewhere. These gaps currently limit how confidently we can extend our findings about general demand for AI-incident data to those settings.
Whether implementing our recommendations would improve users’ decisions remains to be tested (§7). Additionally, as reporting practices and deployment rules evolve, these recommendations will require ongoing reassessment.
Implementing some of the recommendations depends on resources or authority beyond database maintainers’ control. The following priorities show how other institutions can co-enable maintainers to act on this guidance.
Lawmakers and regulators
Standard setters
Authorities sharing and using incident data
Our findings on coverage and defensible assessments support this priority (R4, N3).
Deployers
Funders
We intend to extend the study to 50–60 practitioners, prioritizing professionals managing AI risks within firms (Deployers) and practitioners who adjudicate AI-related disputes (Adjudicators; see Appendix B). Further recruitment will address the institutional and geographical gaps identified in our limitations, including access to restricted security communities. The full report will examine what it would take to adapt data from broader AI-incident databases for specialized uses.
With the sample complete, we will update the counts and reassess the recommendations before publishing the coding procedure with examples that respect participants’ permissions. The full report will explain how coding disagreements affected our judgments.
Following that reassessment, we aim to pilot selected recommendations in the MIT AI Incident Tracker by March 2027, drawing on our own work as maintainers. We will continue developing and testing these recommendations with the MIT AIRI team, other maintainers, and intended users.
Questions for readers
We welcome feedback and expressions of interest in engaging with our research. In particular:
Responses received by December 1, 2026, would be especially helpful.
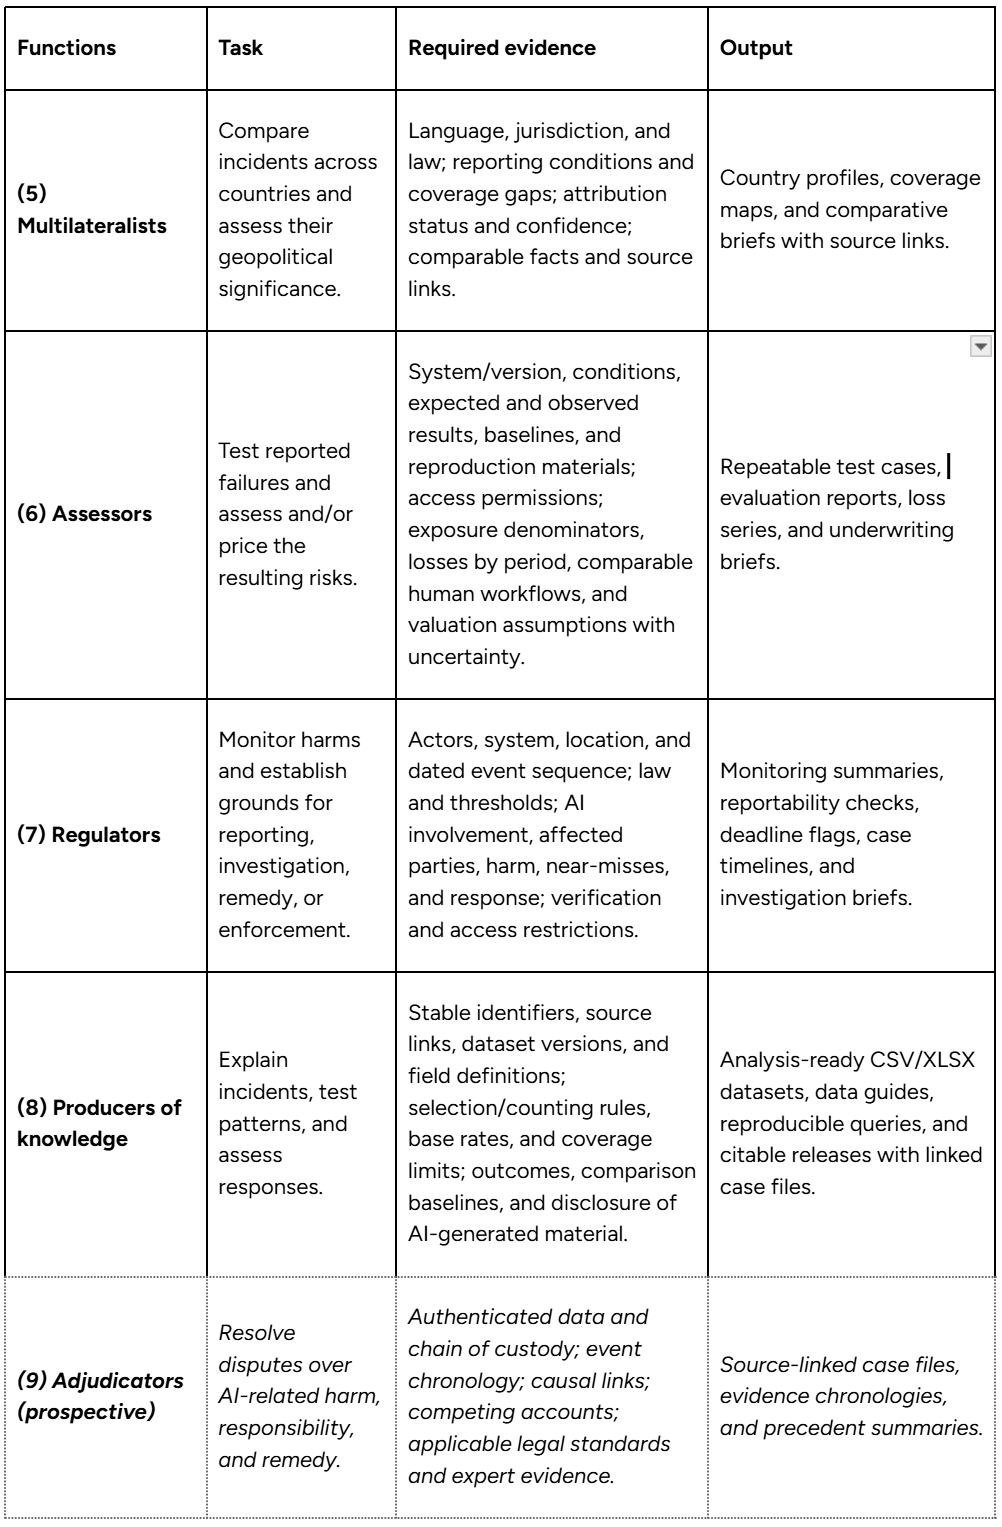
The findings in this report draw on semi-structured consultations and written exchanges with 45 people between June and September 2026. A common five-question guide (see Appendix A) gave the consultations a shared structure for comparing practitioners’ experiences. Before this study began, an MIT-internal mapping of stakeholders within the AI-incident data ecosystem informed the definition of eight professional functions, to which we subsequently assigned consultees based on the tasks that they described, regardless of their institutional affiliation. The core questions and functions remained fixed, with bonus questions adapted to each consultee's role and experience. Table 3 in Appendix B sets out the corresponding tasks and data requirements. Appendix C summarizes the consultees' functions, institutional settings, geographic locations, and professional experiences.
Participants agreed to reporting without names or identifying affiliations, and direct quotations from them were included only with their explicit permission. We recorded consultations where consultees consented. Otherwise, we took handwritten notes. Access to recordings and notes, as well as correspondence, was restricted to the research team. The use of this data for our study received an exempt determination from the Massachusetts Institute of Technology’s Committee on the Use of Humans as Experimental Subjects (COUHES; Exempt ID E-8095). All participants were informed that AI would assist our analysis.
We began that analysis by coding consultation passages by hand. Eight LLMs from eight providers then coded the same passages using the same scheme, each in three runs. We measured agreement, reviewed disagreements against the source passages, and made the final coding decisions ourselves. We will report on the full methodology and agreement metrics in the final paper.
We counted how many consultees raised needs that, in our judgment, each recommendation could address. For each non-recommendation, we counted those who gave substantive grounds for avoiding the practice. Support for a component did not imply endorsement of every clause. We excluded interviewer suggestions and bare assent. Later consultations explored recurring themes more deeply, so our counts also reflect opportunities to discuss each need (Appendix A).
Each person was counted once per item across all conversations and correspondence, though in group consultations we counted only where we could identify the speaker. For each count, we retained links to supporting passages, inclusion criteria, and contrary accounts. Appendix D provides additional information on our demand and deliverability assessments.
Our research began during the summer 2026 fellowship at the Cambridge Boston Alignment Initiative (CBAI), with the financial support of Coefficient Giving.
We thank Alex Mark for managing our research and Emre Yavuz for coordinating the CBAI fellowship. We are also grateful to Branwen Owen for her detailed comments on the draft, and to the MIT AI Risk Initiative team for helping make this report more accessible to its intended audience.
Our deepest thanks go to everyone who participated in consultations: They are unnamed here, in keeping with the promise of anonymity under which they spoke, and they gave their time and their candor generously.
Any errors are our own, and we welcome corrections, as well as further feedback.
Data from the MIT AI Risk Initiative is licensed under CC BY 4.0.
Using purposive and snowball sampling, we recruited participants for semi-structured expert consultations. Referrals brought us 9 of the 45 consultees (20%). We structured all consultations around the following two-part “questionnaire”: Five core questions (A.2) and bonus prompts (A.3). The core questions cover (i) how news of AI incidents reached consultees, (ii) their most recent use or non-use of incident data, (iii) what justified an institution’s use of particular incident data, (iv) how incident databases could better support their work, and (v) where incident databases were structurally unsuited for their work.
While the core questions remained fixed, we tailored each discussion to the consultee’s work. As topics emerged in response to those questions and recurred across discussions, we chose to pursue them in greater depth in later consultations. Where time and relevance permitted, we also used the bonus prompts (see A.3).
Throughout later conversations or correspondence, we returned selected arguments and proposals to some consultees for reconsideration (Appendix C). Their responses helped us develop the model in Figure 1 and the recommendations in §3.
In interpreting accounts, we gave most weight to concrete practices, consequential cases, and qualifications offered without prompting. We made the final coding decisions (§8) and assessed Deliverability with other database maintainers (Appendix D.2).
(i) “How does news of an AI incident reach you? Take the last one that did.”
(ii) “When did you last use AI-incident data, or decide not to? Walk me through that process.”
(iii) “What would justify relying on AI-incident data in your work?”
(iv) “What could AI-incident databases do better for your work specifically?”
(v) “Which parts of your work, if any, are incident databases unsuited to support?”
We supplemented the five core questions with further prompts as the conversation required.
These included recurring closing questions and a prompt specific to maintainers:
Other prompts arose throughout the consultation, drawing on each consultee’s institutional remit, prior work, and earlier claims. Responses to these prompts supplied much of the material for our findings and were coded under the same scheme as responses to the five core questions.
Table 3. Evidence for specific tasks
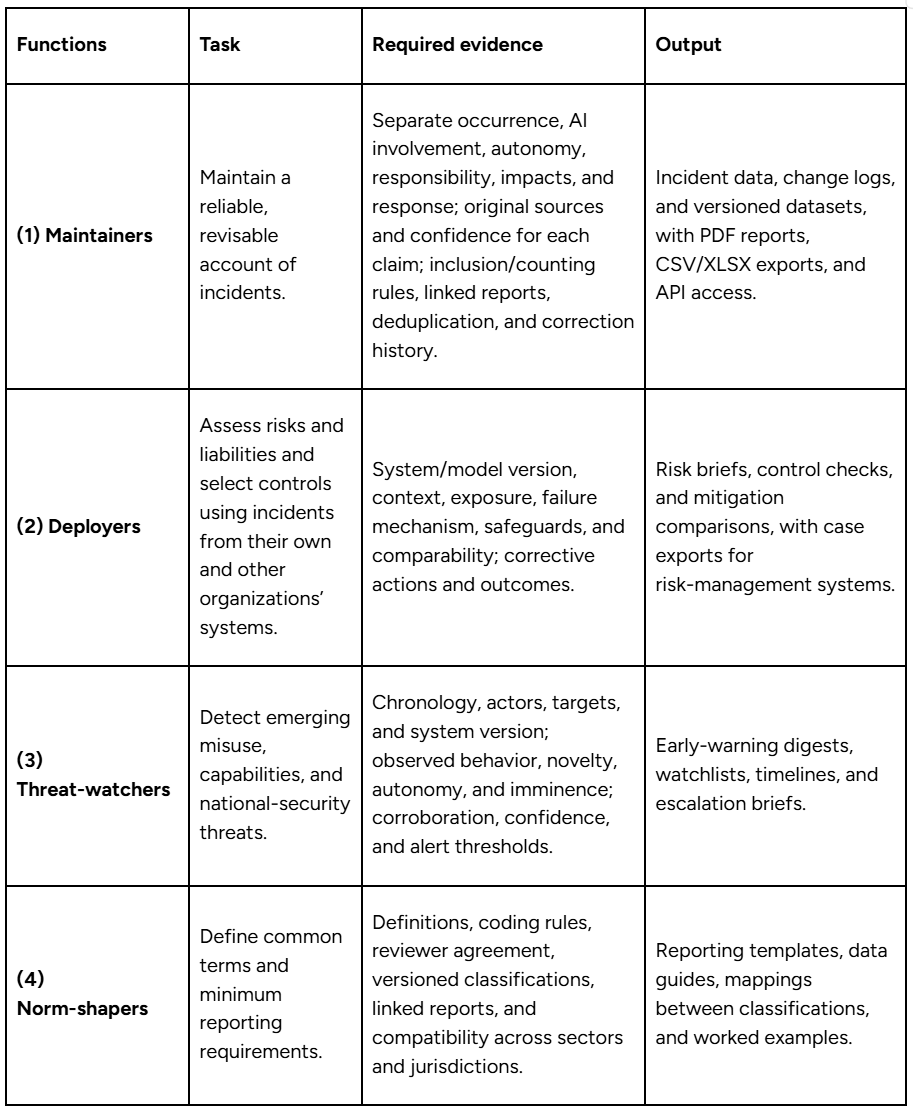
Tables 4–7 summarize our sample of 45 consultees by their professional functions (see Appendix B), cross-cutting institutional settings, geographic locations, and years of professional experience:
Table 4. Distribution by function
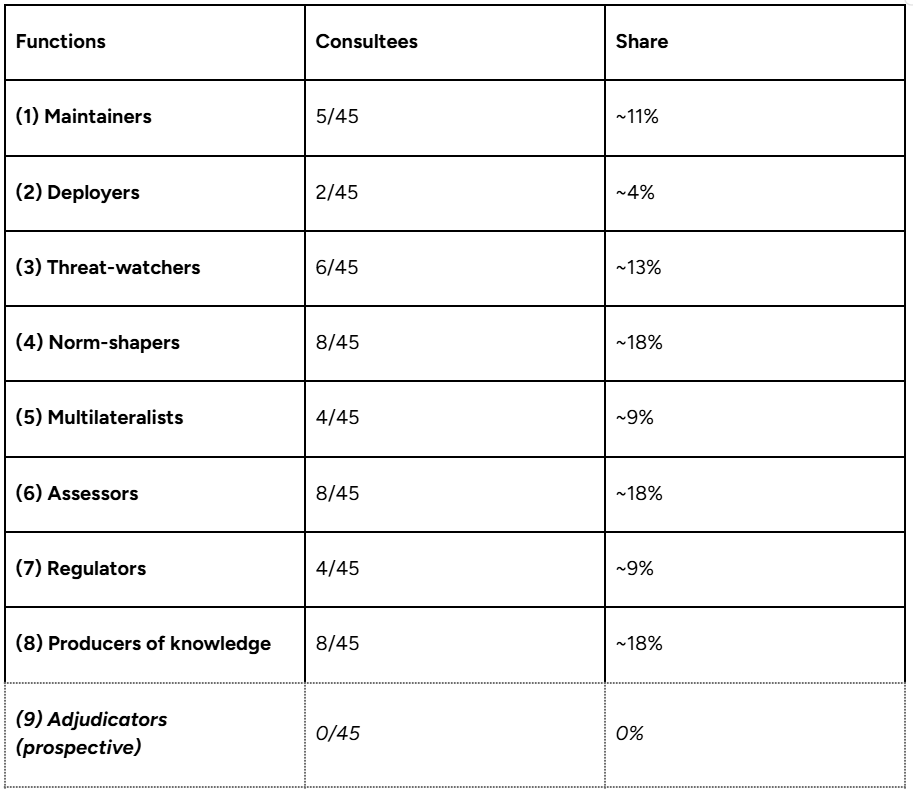
Table 5. Distribution by setting
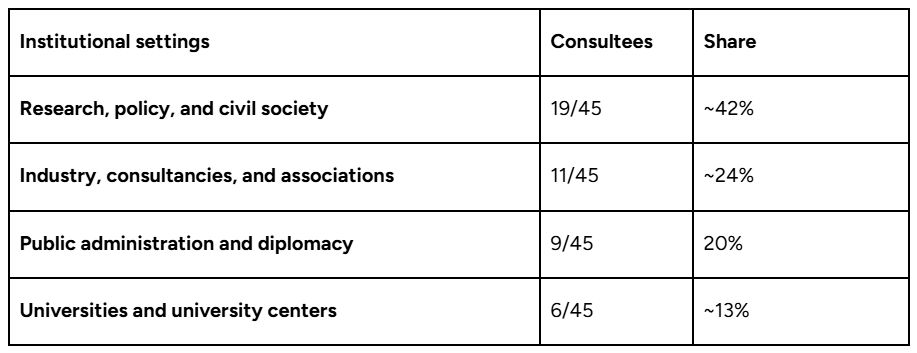
Table 6. Distribution by geographic location
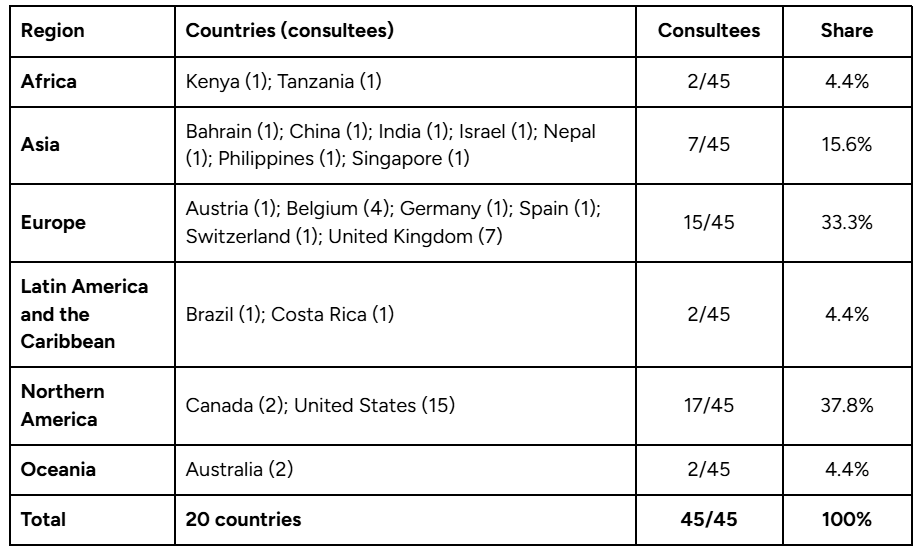
Table 7. Distribution by experience
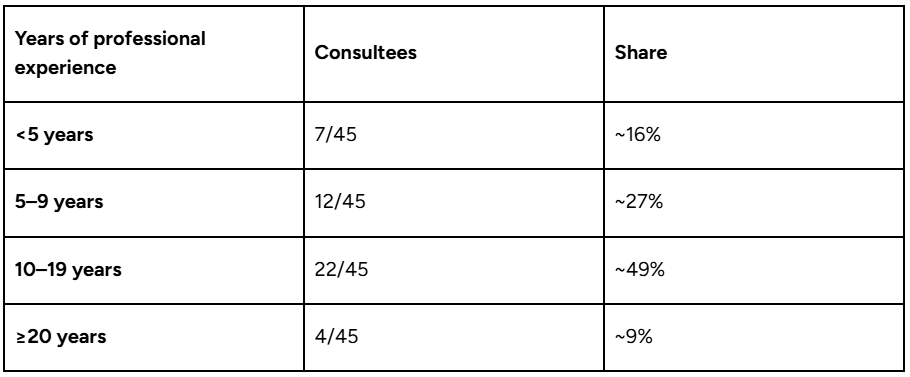
38 of the 45 consultees (~84%) have five or more years of professional experience. Yet, even among those earlier in their careers, accomplishments include securing funding from major venture-capital firms, presenting and publishing peer-reviewed AI research in leading international conferences and journals, respectively, and conducting evaluations at AI-safety institutes.
The bands reflect consultees’ accounts and career histories, which include research and work beyond AI in fields that inform AI risk assessment and governance, such as public health, software engineering, and policy. Time spent in concurrent roles is counted once when calculating years of experience.
Across spoken consultations and written exchanges, seven consultees (~16%) participated in a second round, two of them (~4%) in a third, and one of those (~2%) in a fourth.
A recommendation may answer a widely expressed need and still be difficult to implement, whereas another may be easy to deliver and attract little interest. For that reason, we assess Demand and Deliverability separately, drawing on multi-criteria decision analysis (MCDA).
For each recommendation, Demand shows how many consultees described needs that it could meet. We counted each person once per recommendation.
The ratings reflect a collective self-assessment by our team and other database maintainers, developed through discussions of the requirements for implementing each recommendation in full and sustaining it over time. Table 8 explains how to interpret the ratings used in Table 1.
Table 8. Ratings for Deliverability