Domain taxonomy:
Causal taxonomy:
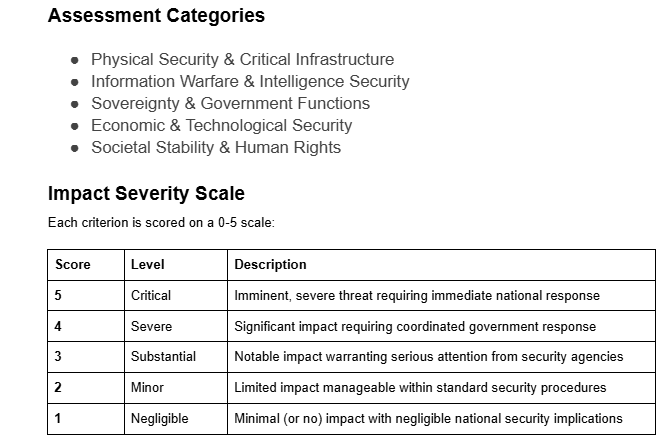
EU AI Act Risk Classification:
AI System Primary Purpose
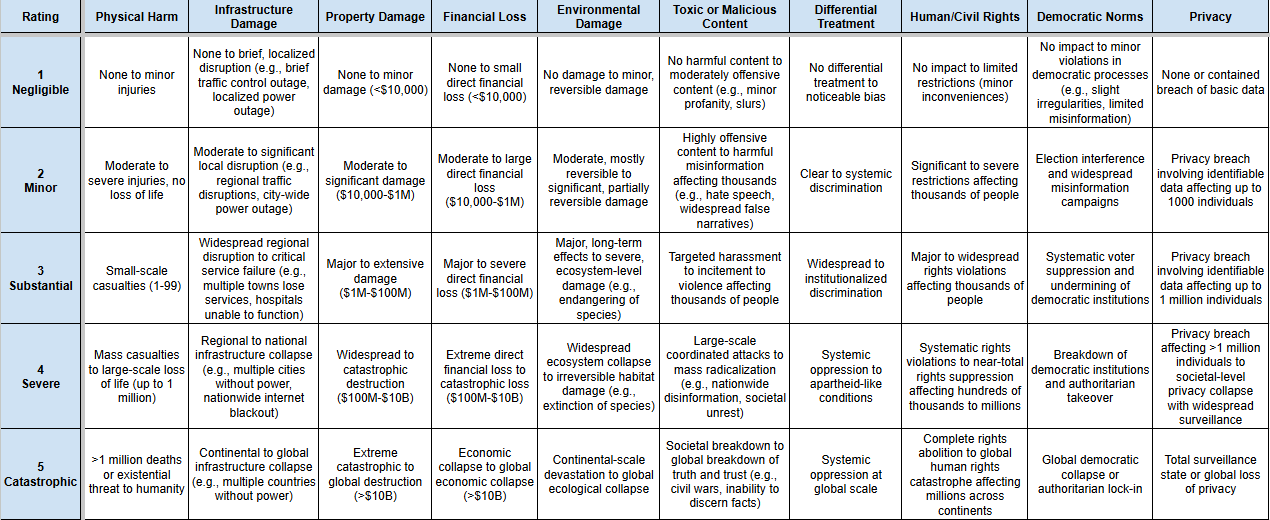
You can explore different views of the database and classification in the project. For example, you can see all AI incidents classified using taxonomies from the MIT Risk Repository, and assessment of severity of harm caused across categories.
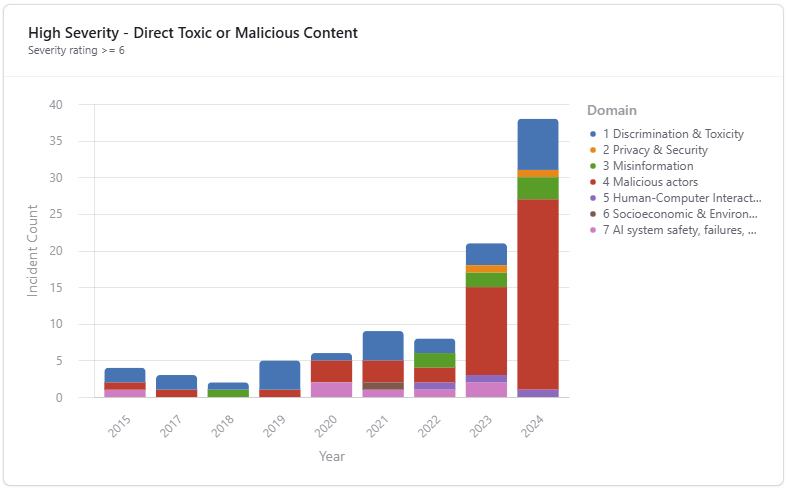
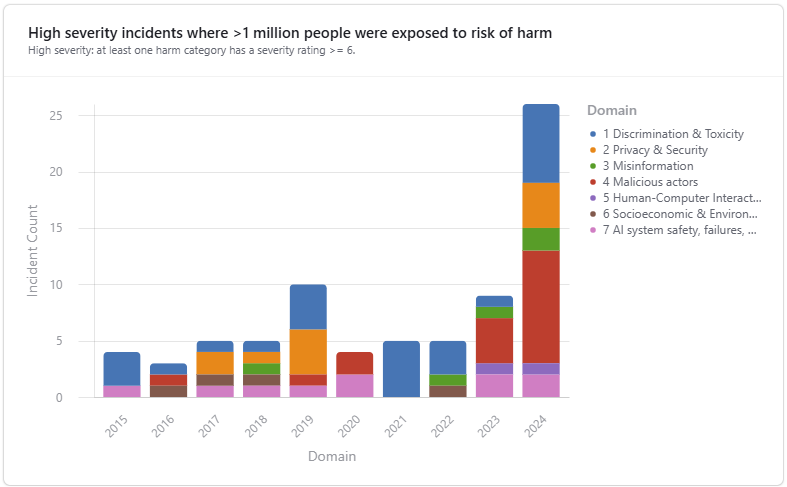
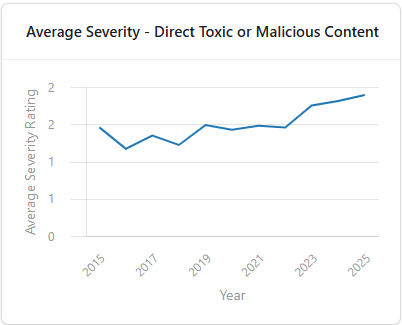
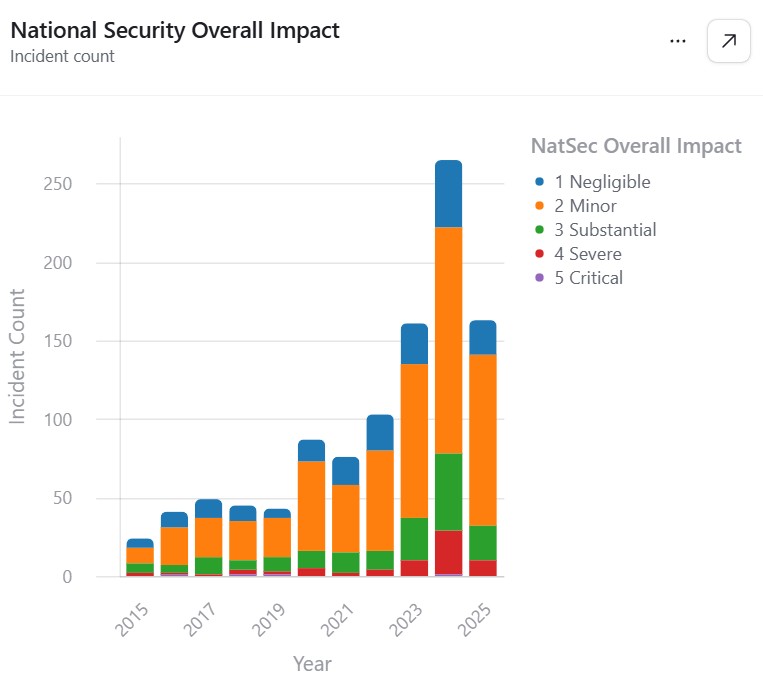
Key visualizations include bar charts and pie charts that display incident counts, proportions across domains (e.g., "System Failures," "Discrimination & Toxicity"), and trends in causal attributes. Additionally, insights highlight patterns such as the prevalence of system safety issues, intentional misuse trends, and incomplete reporting gaps. Click through the links below to explore each of the interactive dashboards.
To see source data or to submit new incident reports, please visit the AI Incident Database.