The MIT AI Incident Tracker classifies more than 1,400 real-world report incidents from the AI Incident Database by risk, cause, harm, severity, and other relevant dimensions.
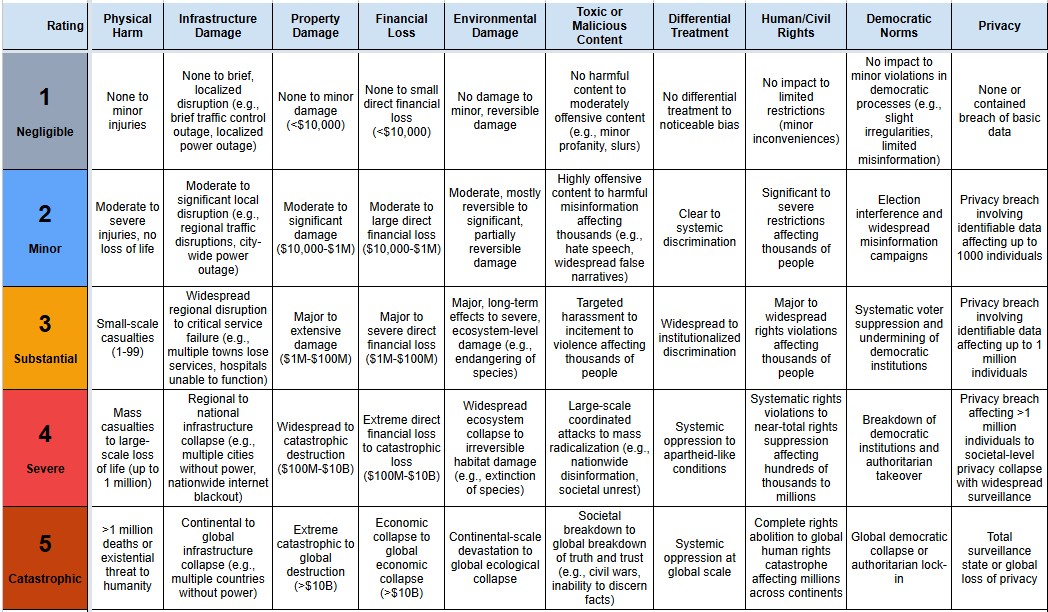
AI incidents are on the rise, yet current databases struggle with inconsistent structure, limiting their utility for policymaking. The AI Incident Tracker project addresses this by creating a tool to classify AI incidents based on risks and harm severity. Using a Large Language Model (LLM), the tool processes raw reports from the AI Incident Database (AIID) and categorizes them using established frameworks, such as the MIT Risk Repository and a harm severity rating system based on CSET’s AI Harm Taxonomy.
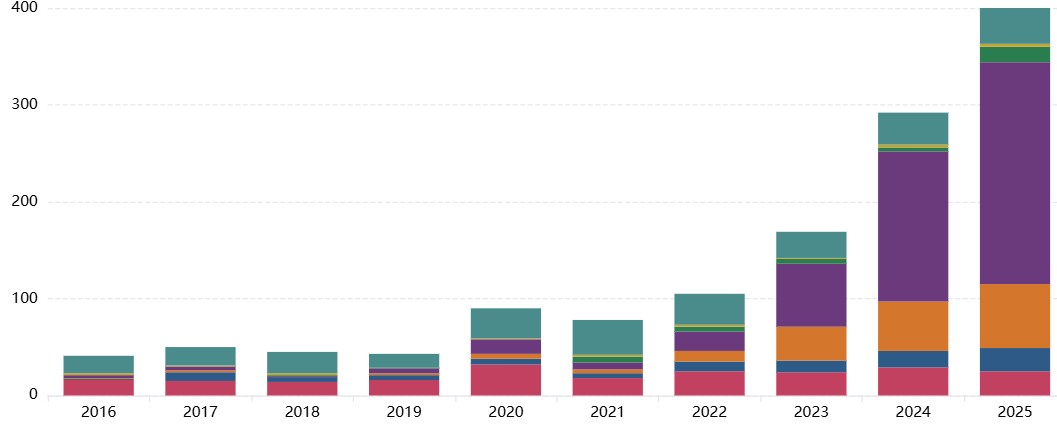
You can explore the AI Incident Tracker using interactive visualizations, including data categorized using MIT Risk Taxonomies, changes in incidents over time, the severity of harm associated with incidents, and more.
The AI Incident Tracker is part of the MIT AI Risk Initiative, which aims to increase awareness and adoption of best practice AI risk management across the AI ecosystem. We build on the great work done by the Responsible AI Collaborative who created and maintain the AI Incident Database, reviewing all submitted reports and ensuring the quality of the dataset. Visit the AIID site to learn more about how incidents are defined and the ingestion process, and to submit a new report to the AIID for review, please use this incident report form.
You can explore different views of the database and classification in the project. For example, you can see all AI incidents classified using taxonomies from the MIT Risk Repository, the type of harm, and individual records in the AI Incident Database.
Key visualizations include bar charts and pie charts that display incident counts, proportions across domains (e.g., "System Failures," "Discrimination & Toxicity"), and trends in causal attributes. Additionally, insights highlight patterns such as the prevalence of system safety issues, intentional misuse trends, and incomplete reporting gaps.
This classification database is intended to explore the potential capabilities and limitations of a scalable incident analysis framework. The classification analysis uses reports from the AI Incident Database (AIID) as input data which rely on submissions from the public and subject matter experts. The quality, reliability and depth of detail in the reports varies across the dataset. As the reporting is voluntary, the dataset is inevitably subject to some degree of sampling bias. Spot-checks have been used to provide feedback on misclassifications and to iterate the tool, improving its reliability, however a systematic validation study has not yet been completed.
Therefore patterns and trends observed in the data should be taken as indicative and validated through further analysis.
Please feel free to share feedback using this form - this will help us make the tool as useful and relevant as possible.
We welcome expressions of interest in engaging with our work - we will continue collecting user-stories to refine the tool.
We work with governments, companies, and researchers to build better tools for understanding AI risk. Subscribe to our newsletter for updates. Get in touch to explore partnership opportunities.